

Caution: Where Are the Worst Roads in the U.S.?
Poor road conditions can lead to crashes and can also cost fleets up to $1,049 a year per vehicle in add-on maintenance costs.

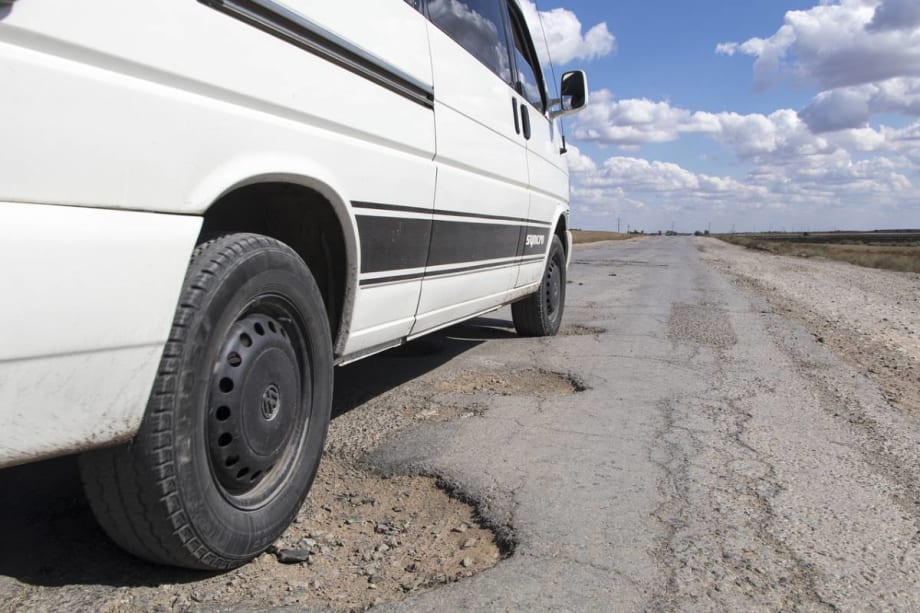
California has the worst, most damanged roads in the nation, according to data from Teletrac Navman.
Photo: Pixabay / odejacob
California is home to the nation’s worst roads, according to new data from Teletrac Navman.
Some 71% of the roads in the San Francisco-Oakland area, 64% of those in San Jose, and 57% of roads in the Los Angeles-Long Beach-Anaheim area are rated poor.
Those are the worst road ratings of any other urban areas in country.
Poorly maintained roads have become costly both for fleet owners and passenger cars. For example, San Francisco’s poor road conditions cost an average $1,049 per vehicle in maintenance and repair costs, which is the highest average repair cost in the country. In San Jose, you can expect to pay $983 more a year in repair costs per vehicle due to poor road conditions.
Disrepair Leads to Safety Hazards
Everything from giant potholes to infrastructure problems afflicts our highways and byways. While repair costs are one issue, safety is another critical concern. Studies show that poor roads are linked to more crashes.
Stakeholders at the local, state, and federal level must work diligently to improve our roadways to reduce crashes, injuries, and fatalities.
The Golden State is not the only state with bad roads. For example, Honolulu, Hawaii ranks fourth on the worst roads list — 54% of roads are considered to be poor and only 9% are considered to be good. The average cost of vehicle maintenance and repair due to bad road conditions is $851.
Tied with Honolulu at the number four spot is Milwaukee, Wisconsin, with 54% of roads being in poor condition. The average additional vehicle repair cost in Milwaukee is $944.
Other urban areas that ranked among the top 10 for worst roads include Akron and Cleveland, Ohio — each with 49% of roads rated poor, the New York, NY-Newark, NJ area with 46% of roads considered poor, Providence, Rhode Island (46%), and Philadelphia (43%).
Bad Roads Drive Up Maintenance Costs
Bad roads can cause major damage to a vehicle. Whether it’s a car, van or truck, rough or bumpy roads can damage a vehicle’s alignment. Poor alignment can also increase the wear and tear on tires, reducing their lifespan and requiring more frequent replacement. Tires are also at higher risk of becoming flat. Additionally, poor road conditions can distort a vehicle’s suspension system, which impacts the car’s ability to balance on the road.
Equipment maintenance is one of the biggest cost centers for vehicle owners, according to a survey from Teletrac Navman.
As the quality of the infrastructure decays, maintenance costs increase. A vehicle in San Francisco/Oakland costs three time more to maintain than one in Boston.
In fact, the three places with the lowest average additional maintenance costs are Rochester ($305), Boston ($306), and Portland, Oregon ($309). Noteworthy, both Boston and Portland are also on the list of cities with the highest percentages of roads categorized as good.
The top five urban areas with the highest percentage of good-rated roads are Orlando, with 69% of roads deemed good, Atlanta (66%), Boston (65%), Portland, Oregon (55%), and Jacksonville (55%).
Houston Transforms Dangerous Road
While there is much work to be done nationwide when it comes to improving dangerous roads, the City of Houston can boast a recent success story. Hillcroft Avenue in Houston’s Gulfton neighborhood had a crash rate twice the state average compared to similar urban roadways, often involving vehicles colliding with pedestrians and cyclists with severe or fatal results.
But a groundbreaking public-private partnership transformed the dangerous corridor into a safer roadway.
The City of Houston and Mayor Sylvester Turner’s Complete Communities program teamed up with Together for Safer Roads (TSR). Working closely with local government agencies, non-profits, and private sector companies the partnership implemented a series of road safety initiatives.
For example, Hillcroft Avenue now features very specific improvements tailored to safety concerns, including wider sidewalks, shared-use bikeways, new traffic signals for pedestrian access, improved access to metro stops, and a reduction of general-purpose vehicular travel lanes from eight to six.
In addition, the reallocation of roadway has led to motor vehicle speed reductions of five to 10 mph, which affects injury outcomes should a collision occur, especially if pedestrians and cyclists are involved.
The better the road, the safer for all road users. Safety advocates believe the Hillcroft Avenue project can prove to be a strong model for replication in other road safety initiatives nationwide.
From 2000 to 2020, the share of major roadways in poor condition has remained fairly steady, rising from 11.8% to 13.8% over 20 years, according to Construction Coverage. Yet there is hope that roads are improving — with the share of roads in good condition steadily increasing from about 45% in 2000 to 53% in 2020.
More Safety
Ram Recalls More Than 1.27 Million 1500 Pickups for Seat Belt Anchor Issue
The recall affects certain 2019-2026 Ram 1500 pickups that may have improperly attached second-row seat belt buckle anchors.
Read More →
Top 50 Executive Fleets
It is that time of year again! Time for the 2026 list of the Top 50 Executive Fleets, presented by Automotive Fleet and Volvo as part of its annual Fleet 500. Download now to see this year's list of companies!
Read More →
How Better Visibility Cut Speeding Violations by 48%
Fleet leaders don't need more data, they need clearer visibility into what the data is saying. This case study explores how one utility replaced speeding-event counts with a single metric — miles driven in violation — to strengthen safety and significantly reduce speeding violations.
Read More →
Operation Safe Driver Week: Why the Industry's Oldest Safety Campaign Still Matters to Fleets
A look at how a 2007 enforcement initiative became one of the most consequential weeks on the fleet safety calendar, and what it means for your drivers in 2026.
Read More →
Nexar-Nauto Merger Aims to Give Fleets Better Safety Intelligence Through Larger Driving Dataset
Stefan Heck tells Automotive Fleet that combining more than 10 billion miles of driving history with Nexar's AI models will give fleets deeper insights into driver risk and roadway conditions than either company could provide independently.
Read More →
From Silos to Solutions: Relationship Management for Safer Fleets
From telematics adoption and driver accountability to policy consistency and risk mitigation, this episode breaks down what it really takes to build a safer fleet culture without slowing business down.
Read More →
IIHS Launches First Commercial Vehicle Safety Evaluations
The Insurance Institute for Highway Safety has begun evaluating heavy-duty pickups and cargo vans for driver protection. Which models earned top marks?
Read More →
Reducing Risk by Eliminating Phone Use Behind the Wheel
Hosted with the cofounder of Lifesaver Mobile, this episode addresses phone use behind the wheel and how to design a driving environment that actually helps prevents accidents.
Read More →
Cameras, Safety and Insurance: From Reactive Claims to Real-Time Prevention (Part 2 of 2)
Part Two: Commercial auto remains one of the most challenging and costly lines of coverage for fleet operators and insurers alike. Continue learning more about how to effectively address these issues from Onur Aksan, Enterprise Business Development Executive, Geotab
Read More →
How 5-Second Telematics Data Is Changing Fleet Safety
This episode connects with Steve Santostasi of Ford Pro and covers how a few seconds of data can make a difference in fleet safety.
Read More →