




How to Calculate EV vs. ICE Vehicle Cost Per Mile
We’ve all heard that fleeting EVs will lower your “fuel” bill considerably compared to an ICE vehicle. But by how much, exactly? Here’s the formula.
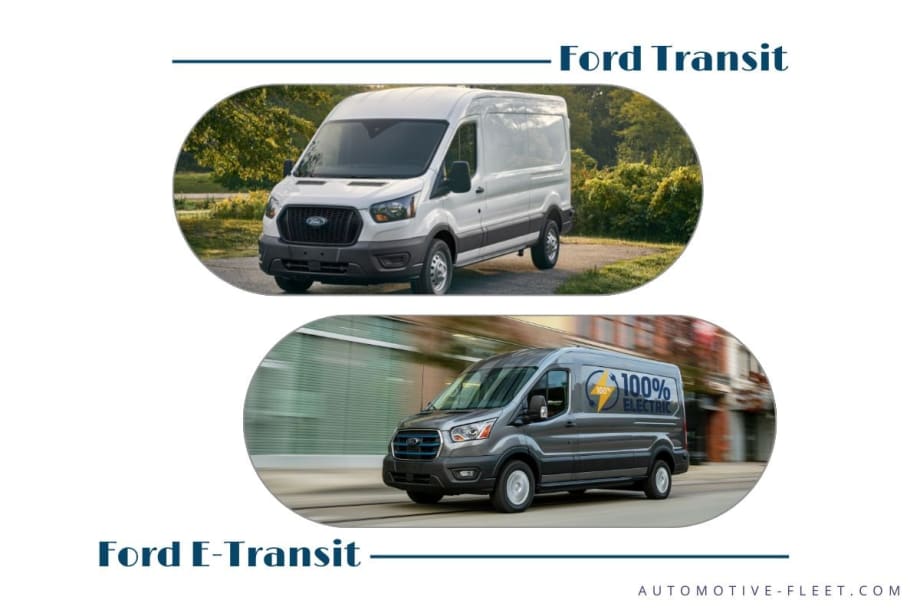
We compared estimated energy costs for the all-electric Ford E-Transit to fuel costs for the Transit T-150 Van with an ICE engine.
Photo: Ford/Canva
Calculating energy costs per mile for EVs and comparing them to fuel costs for and ICE vehicle is an important metric as you migrate your mixed fleet toward EVs and chart expenses for both. We’ve all heard that fleeting EVs will lower your “fuel” bill considerably compared to an internal combustion engine (ICE) vehicle. But by how much, exactly?
We’ll give you the formula and some hypotheticals; it’ll then be up to you to input your data based on your real-world scenarios.
To make as much of an apples-to-apples comparison as possible, we’ll compare the all-electric Ford E-Transit to the Transit T-150 Van with an ICE engine.
Defining EV Range
The E-Transit has a 68kWh battery and a published top range of 126 miles for the low-roof E-Transit cargo version. The van’s battery size and range are our first two inputs.
Range is, of course, negatively affected by real-world factors such as payload, towing, ambient temperature and weather, cabin heat or A/C use, road conditions, and elevation gain and loss during a trip. (We’ll leave towing out of this analysis.)
So, calculating some loss in range for real-world conditions is warranted. But by how much?
Ambient temperature has shown to have an outsized effect on range compared to the other factors. According to EV models tested by Geotab some EV models performed better than their EPA-rated ranges in mild weather, peaking at 115% at 70 degrees Fahrenheit.
However, the loss of range is dramatic approaching the extremes. For example, at 5 degrees, EVs dropped to 54% of their rated range in the Geotab study. At 115 degrees, they experienced a 30% drop. In addition to battery thermal management issues at those extremes, using air conditioning or a vehicle’s heater will contribute to range loss — with the heater causing substantially more range loss.
We’ll avoid those extremes. Instead, we’ll factor in a combination of range inhibitors that will take another 20% off range, leaving us at 101 miles of total usable range.
(Side note: Maximum ranges are achieved by charging to 100%, but for battery health the recommendation is to charge to 80% and never fully deplete the battery. This will deplete your usable range even further, but the price calculation is the same.)
EV Range Formula
Now for the formula. Before we plug in our calculations, there is one more variable to determine: charge per kilowatt hour. That price varies greatly, depending on home, depot, or retail charging, utility rate structure, and even time of day.
We’ll use two ballpark prices, assuming first that we’re charging at a depot at $.15/per kWh, and next at a retail location at $.20/per kWh. With that, the calculation is twofold:
Battery kWh Size / Your Cost Per kWh to charge = Cost per Range
Your Cost per Range / The Vehicle’s Stated Driving Range = EV Cost per Mile
Calculating E-Transit Cargo Van’s Stated Range at $.15 Per kWh
68kWh battery x $0.15 charge per kWh = $10.20
$10.20 / 126 Miles = $0.08 per mile
Now let’s plug in the more expensive retail price of electricity:
Calculating E-Transit Cargo Van’s Stated Range at $0.20 Per kWh
68kWh battery x $0.20 charge per kWh = $13.60
$13.60 / 126 Miles = $0.11 per mile
ICE Range Formula
Now let's compare those prices to the Transit T-150 with an internal combustion engine. Of course, real-world fuel economy differs from EPA-rated ranges or manufacturers’ targets. At 8,600 lbs. GVWR, the Transit cargo van falls outside of EPA’s fuel economy jurisdiction.
However, there are resources to ascertain fuel economy for commercial vehicles. While far from scientific, this site has directional data to benchmark. From user data on the Ford Transit across recent model years, we came up with an average of 14.6 miles per gallon. We pulled real-world MPGs from this site that tracks fuel economy from real-world use cases. We will use that MPG with the AAA national average of $3.66 per gallon of fuel as of Nov. 21 — again, a moving target, especially these days.
Gallons Used x Your Fleet’s Cost Per Gallon = Cost per Range
Cost Per Range / Range = ICE Cost per Mile
Inputting the ICE data from Ford AWD Transit T-150 Van:
126 / 14.6 = 8.63 gallons used x $3.66 per gallon = $31.59
$31.59 / 126 = $0.25 per mile
These calculations suggest a range of $0.14 to $0.17 in energy cost savings per mile depending on the kWh charge rate applied.
Calculating the cost per mile for a fleet van that drives 15,000 miles per year, the total cost for the E-Transit would be $1,200 or $1,650, while gas-powered Transit T-150 would cost $3,750. Driving the E-Transit would result in savings of $2,550 or $2,100.
Many Other Costs
If you are looking to determine total ownership costs (TCO), there are many other costs to consider such as maintenance, initial costs, depreciation, opportunity cost, and insurance, as well as costs to install and maintain chargers, if you choose to include those in TCO.
Regarding energy and fuel costs specifically, remember these are average inputs, not actual. If you’re looking to acquire an E-Transit and are looking to determine operating costs, you’ll need to estimate your range — which isn’t easy when you haven’t yet driven the van. Ask your manufacturer’s rep or local dealer for advice. Or there are many third-party consultancies and even utilities with cost calculators to help calculate range and TCO in general.
About the Author: John Ellis, The EV Guy, can be reached at john@beveverything.com.
More Operations
Avis Budget Group Deploys Neology Toll Management Technology Across Major Brands
Neology’s neoFleet platform will manage toll transactions and toll-authority operations for vehicles across Avis, Budget, Payless, Budget Truck and Zipcar.
Read More →
Fleet Personal-Use Charges Edge Higher in 2026
Nearly eight in 10 surveyed fleets allow personal use of company vehicles, while just over half of respondents report charging employees for the privilege.
Read More →
The Future of Fleet + What’s Changing Right Now | AF News Recap
Could developments overseas offer a preview of what’s coming for U.S. fleets? This week, we’re looking at the future of AI, autonomy, and electrification, plus Ford Pro’s new certified pre-owned program, smarter vehicle offboarding, and a new way for fleets to manage toll expenses.
Read More →
How to Handle Vehicle Offboarding
What do fleet managers need to do when a driver leaves?
Read More →
Fleet Manager’s Ultimate Playbook: Navigating the New Standard in OEM Connectivity
Rising operating costs, driver safety concerns, and unplanned downtime are putting unprecedented pressure on modern fleets. Discover how fleet managers use embedded OEM connectivity and real-time vehicle data to cut TCO, prevent downtime, and protect drivers without aftermarket telematics hardware.
Read More →
U.S. Bank Adds Verra Mobility Toll Management to Voyager Fleet Platform
The integration allows U.S. Bank Voyager fleet customers to manage toll payments and violations alongside fuel, EV charging and maintenance expenses.
Read More →
ADAS Prevents Crashes. But Repairs Cost More | AF News Recap
ADAS-equipped vehicles may crash less often, but they can cost more when they do. This week, we’re breaking down what that tradeoff means for fleets, plus Subaru’s first Forester Wilderness Hybrid, Nissan’s new e-POWER Rogue, and why Calstart has become Catalyst Mobility.
Read More →
Moventum Fleet Management Names Mark Iorillo Head of Sales
Iorillo brings nearly 20 years of fleet management and sales experience to the role, including previous positions at Element Fleet Management, CEI, Donlen and Ryder.
Read More →
Fleet Has a Talent Pipeline Problem. What Comes Next? | AF News Recap
Where will fleet’s next generation of leaders come from? This week, we’re looking at the industry’s talent pipeline, what certification can add to a fleet career, how to build an award-worthy track record, and the return of Automotive Fleet’s Personal Use Survey.
Read More →
Smith System Launches Driver Risk Management Program
Fleets have more driver data than ever, but identifying risky behavior doesn't necessarily correct it. Smith System's new Driver Risk Management program combines monitoring, training, and follow-up coaching to help fleets connect risk signals with driver intervention.
Read More →