


Read More: What Does Leasing Decline Mean for Used Auto Supply?
YTD Fleet Sales Trending Positive
The supply issues plaguing automotive are ameliorating month over month, but to varying degrees depending on fleet type.
November 3, 2022
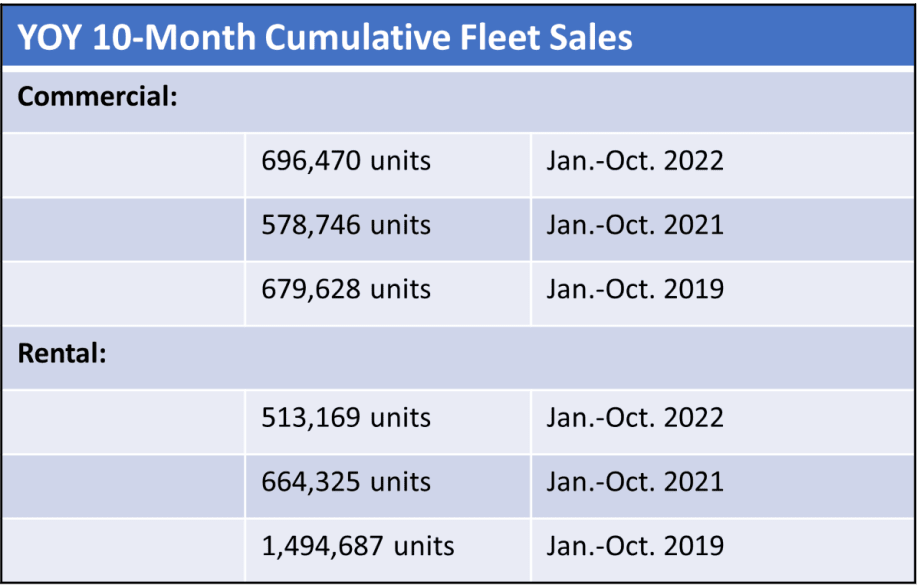
For commercial fleets, cumulative sales for 2022 represented a 20.3% increase over 2021 — and 2.5% over 2019. On the rental side, sales are trending higher month over month as well. Yet overall for the same period, sales are still underwater to 2021 and an even greater percentage — 66% — lower than 2019.
Data: Bobit
4 min to read
We have 10 months of U.S. fleet sales under belts, which represents a good indicator of how the market is progressing this year in the return to normal — or, more precisely, the quest for a new normal.
The data shows positive trendlines but diverge depending on fleet types. So before digging into the fleet sales numbers that Bobit collects, it’s relevant to outline the differences between sales to commercial, rental, and government fleets.
Sales Differences Between Fleet Types
Car rental companies fleet more than twice the number of commercial units in a given normalized year. For instance, in 2019 1.74 million vehicles were sold into rental, while 800k were sold to commercial fleets. (Government fleet sales are much lower than that on a yearly basis — totaling 254k for 2019.)
Commercial fleet sales are fairly consistent month to month, with about 60,000 to 80,000 units sold in any given month in a normal year and a mild swell in Spring.
Rental fleet sales on the other hand are more seasonal, with much bigger sales spikes in the Spring to meet summer demand. Fleet sales to rental range from a high of about 200,000 units in March to a low of about 85,000 units in July.
Rental fleet sales consist mostly of passenger cars and some trucks, while commercial fleet sales are predominantly trucks with a much smaller percentage of cars.
Rental fleets keep their vehicles for six to 18 months generally, while commercial fleets run vehicles from 36 months to five and seven years – and longer.
As the largest fleet acquisition entity outside of the federal government, rental fleets had been traditionally able to buy vehicles at as close to “triple net” of invoice – what a dealer pays for vehicles – as any type of buyer.
In the last few years automakers have been public on their intent to limit rental fleet sales while supplying commercial and government fleets as best they can. There has been a traditional perspective that rental fleets can damage a model’s residual value with their shorter cycles and opportunity to flood the secondary market with cars.
The reality is a bit more complicated, though any fleet consignor with the ability to put thousands of cars into the secondary market at a given time can move pricing. This traditional assumption has been turned on its head in this new supply-constrained environment, as even rental companies had to, for a time, pay over MSRP for vehicles.
2022 Year-Over-Year Fleet Sales
Now to the year-to-date sales numbers.
In a tangible sign that the supply crunch is easing, sales to commercial fleets were up over 2021 in every month to date. A 3.8% increase in January 2022 increased to a cumulative 11.6% gain by July and an overall increase of 20.3% through October.
A better indicator of a positive market correction is comparing sales to the same period in 2019, our last benchmark “normal” year. Comparing commercial fleet sales to date in 2022 compared to the same period in 2019 reveal a 2.5% increase over the same period.
On the rental side, sales are trending in the right direction as well, but are still underwater to both 2021 and 2019.
Month over month, rental fleet sales started 2022 in January at a 61.3% deficit to January 2021. That percentage steadily improved month to month. By October, the cumulative gap was down to “only” 22.8% compared to 2021. However, rental sales over the first 10 months of this year are still at a whopping 66% deficit to the same period in 2019.
Regarding government fleet sales, year-to-date sales of 162,219 are 5.8% over the same period in 2021, yet that’s 24.5% fewer units sold than in 2019.
Overall, the numbers show positive trends, but a stark contrast by fleet type. While commercial fleet sales have returned to normal patterns, rental fleet sales have not. It remains to be seen if this present pattern will turn into a “new normal” for rental fleets.
Positive Signs in October SAAR
The uptick in fleet sales mirrors an increase in the overall market.
The U.S. seasonal adjusted annual rate (SAAR) for October is 15.1 million units, up from 13.4 million in September, according to data from LMC Automotive. That’s only the second time that the rate has exceeded 15 million units per year in 2022.
“While the industry continues to face challenges on a number of different fronts, some encouragement can perhaps be drawn from the October results,” said David Oakley, manager, Americas sales forecasts for LMC Automotive, a press statement.
“The 15 million units-per-year mark has only been surpassed twice since the first half of 2021, providing some cheer heading into the final two months of 2022,” he continued. “Inventory levels have improved notably over the last two months, relieving some of the pressure on the supply side of the market.”
Oakley cautioned that progress may not be linear, as logistical problems, rising interest rates and financing costs, and average transaction prices still at near-record levels could negatively affect the market.
More State of the Fleet Industry


‘Mike Just Gives Cars to People’ — And Other Misconceptions Fleet Managers Need to Fix
Most organizations misunderstand fleet. The best managers make sure that doesn’t happen.
Read More →Sponsored•May 29, 2026
Are You Tracking Your Fleet's True Total Cost of Ownership?
Bobit Business Media surveyed 190 fleet professionals and found that while most fleets are tracking costs, fragmented systems and data gaps are keeping true TCO visibility out of reach. With rising pressure to control spend in an increasingly volatile environment, the gap between what fleets think they know and what the data actually shows is wider than you might expect. See how your peers are managing costs today and where the industry still has room to improve.
Read More →
Why Union Leasing Rebranded to Moventum Fleet Management
Mark Hogland discusses Union Leasing’s transition to Moventum Fleet Management and how the rebrand reflects the company’s growing focus on strategic fleet management and lifecycle support.
Read More →
Sponsored•May 13, 2026
Why Fleet Managers Are Replacing Departmental Vehicles with Shared Motor Pools
Departmentally assigned vehicles often create hidden costs through underutilization, poor visibility, and increased administrative burden. This white paper explores how shared motor pool strategies help fleets reduce costs, improve accountability, and optimize vehicle utilization.
Read More →
From Storm Response to Data Strategy: Fleet Trends to Watch | AF News Recap
In this AF news recap, host Faith Howell covers this week's most pressing industry updates.
Read More →
Report: 36% of Fleet Managers Are Delaying Replacements
Element’s 2026 Market Pulse Report finds fleets are slowing replacement cycles amid tariffs, economic uncertainty, and rising costs.
Read More →
California Adopts Sweeping New Autonomous Vehicle Regulations
Updated DMV rules open the door for heavy-duty AV testing and deployment while strengthening safety standards, emergency response coordination, and manufacturer accountability.
Read More →
Sponsored•May 6, 2026
Fleet Costs Are Rising: Here’s How Leaders Are Responding
Fleet leaders are under pressure to reduce costs, adapt to economic uncertainty, and make smarter decisions. See how peers across North America are responding with real data, proven strategies, and forward-looking insights. Download the 2026 Market Pulse Report to benchmark your strategy and uncover where you can gain an edge.
Read More →
Stellantis Taps Hyundai Exec to Lead U.S. Sales
Effective April 22, Jeep maker Stellantis has named Michael Orange as vice president of U.S Sales.
Read More →