




Ride-Hailing: A Major Contributor to City Congestion
The study, commissioned by Uber and Lyft themselves, exposes the ride-hailing congestion problem - and it's worse than we thought. However, Uber says the scale "is dwarfed by that of private cars and commercial vehicles."


The study looked at combined vehicle miles traveled (VMT) in September 2018 in six major metropolitan areas: Los Angeles, San Francisco, Seattle, Chicago, Boston, and Washington, D.C.
[EMPTY CREDIT]
Decreasing traffic congestion has often been touted as the primary reason behind the use of ride-hailing apps. However, a new study, commissioned by ride-hailing giants Uber and Lyft, found that ride-hailing vehicles actually increases traffic congestion in major cities.
The study looked at combined vehicle miles traveled (VMT) in September 2018 in six major metropolitan areas: Los Angeles, San Francisco, Seattle, Chicago, Boston, and Washington, D.C. It revealed that ride-hailing vehicles' average VMT to be in the low single digits as a percentage when compared to overall vehicle traffic.
In the Seattle area, Uber and Lyft rides made up 1.1% of VMT, the lowest percentage recorded in areas studies. At its highest in the San Francisco metro region, Uber and Lyft made up 2.7%.
Metro region | Other other VMT | Uber, Lyft VMT |
|---|---|---|
Boston | 98% | 2% |
Chicago | 98% | 2% |
LA | 99% | 1% |
San Francisco | 97% | 3% |
Seattle | 99% | 1% |
Washington, DC | 98% | 2% |
VMT numbers change when looking at metro region vs. core county.
For instance, while ride-hailing in the San Francisco metro area contributed 2.7% to total VMT, in core county, in made up nearly 13%. The gap is smaller in some areas, like Seattle, where VMT for the county increased to 1.9% on average.
Core rounty | All other VMT | Uber, Lyft VMT |
|---|---|---|
Suffolk County (Boston) | 92% | 8% |
Cook County (Chicago) | 97% | 3% |
Los Angeles County (LA) | 97% | 3% |
San Francisco County (SF) | 87% | 13% |
King County (Seattle) | 98% | 2% |
Washington, DC (City limits) | 93% | 7% |
Among the reports findings was the revelation that on average, Uber and Lyft drivers spend the majority of their time driving without passengers in the vehicle.
Originally posted on Auto Rental News
More Operations

How to Write Better AI Prompts for Fleet Analysis
Include these six elements in your fleet prompts to generate more relevant analysis and accurate answers.
Read More →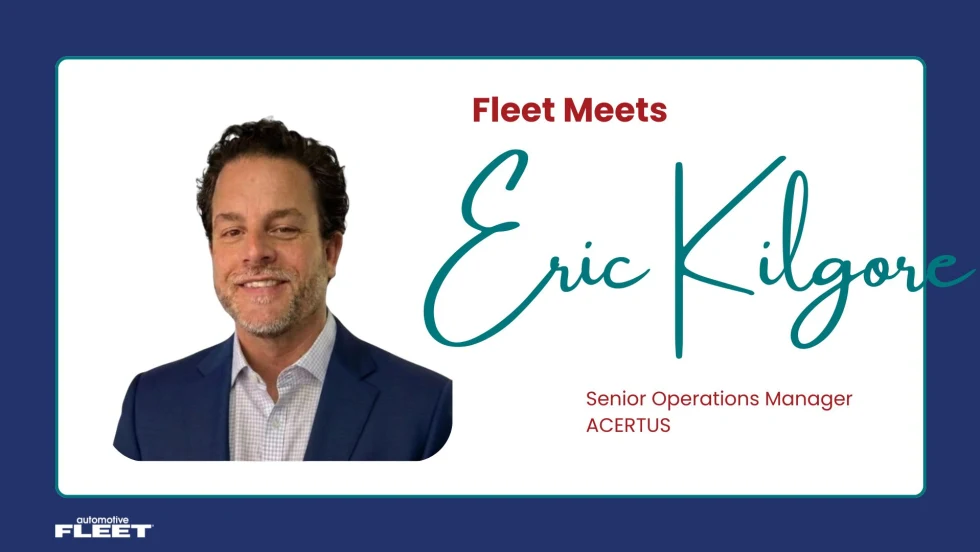
Fleet Meets: Eric Kilgore
This edition of the Fleet Meets series features one of the industry's best leaders driving multi-market and national operations.
Read More →
Why Reactive Fleet Management Is Becoming Too Expensive to Sustain
Research highlights a growing need for proactive management strategies to address rising costs in fleet operations effectively.
Read More →

What Your Fleet KPIs Aren’t Telling You
Tracking fleet metrics is only useful when the data leads to better decisions. This guide helps fleet leaders assess cost, utilization, and downtime more accurately, identify performance gaps, and prioritize the actions that can improve operational results.
Read More →
Hidden in Plain Sight: Fleet Compliance Risks
Fleet compliance isn't just about having policies — it's about consistently enforcing them. This practical guide reveals six hidden compliance risks common in public sector and shared fleet operations and outlines proven strategies to improve visibility, accountability, and audit readiness
Read More →
Turning Fleet Payment Data into Executive Insights
Does data alone drive results in operations?
Read More →
Automotive Fleet Opens 2026 Personal Use Survey for Commercial Fleet Managers
Commercial and corporate fleet managers are invited to share how their organizations handle company vehicle personal-use policies, charges, and driver eligibility.
Read More →
Gary Van Orden Retires After Nearly Four Decades in Commercial Fleet
From answering customer calls at Ford Motor Company to leading fleet sales across multiple OEMs and a fleet management company, Gary Van Orden's career reflects nearly four decades of leadership in commercial fleet.
Read More →
How Stellantis Plans to Get Ahead of Fleet Downtime
Vehicle acquisition may grab the headlines, but fleet uptime increasingly determines operating success. Darren Bradshaw of Mopar North America gives the details.
Read More →
Hyundai Releases 2027 Commercial Program Incentives
The 2027 Model Year "Fleet Street Incentives" are available to commercial and government fleets.
Read More →