


Related: ARI Launches Fleet Monitoring Tool
ARI Offers Accident Data Feed
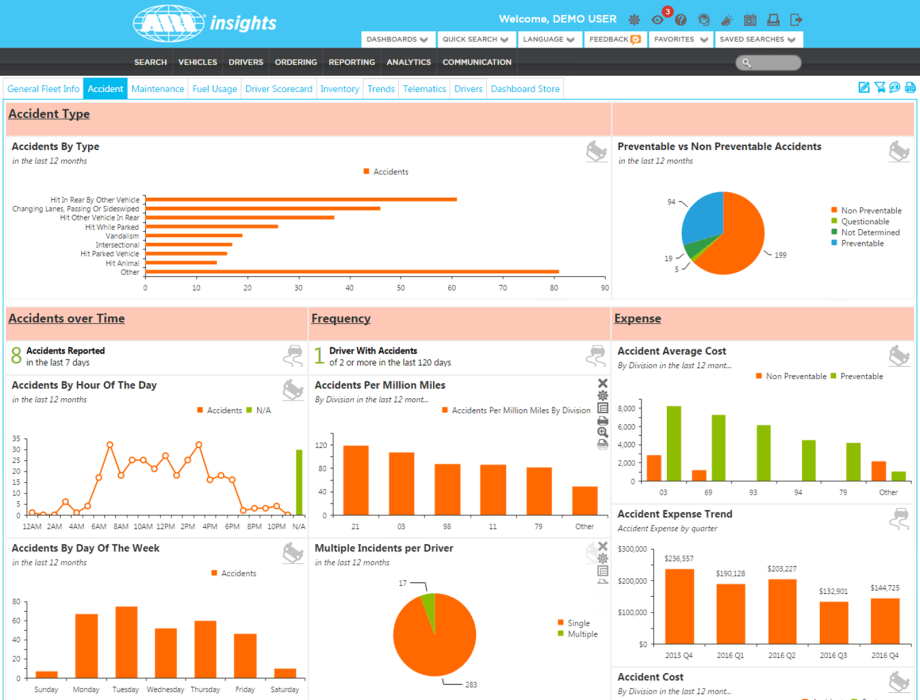
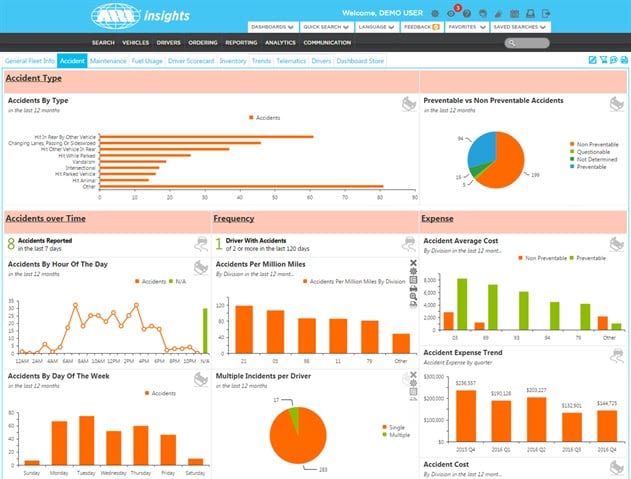
ARI has added the Accident Dashboard to its insights portal that allows fleet managers to see the cost of accidents, as well as identifying trends and patterns.
March 29, 2017
Screenshot of Accident Dashboard courtesy of ARI.
2 min to read
Screenshot of Accident Dashboard courtesy of ARI.
ARI has added an Accident Dashboard to its ARI insights portal that's designed to allow fleet managers to see the impact accidents have had on a company’s bottom line and identify trends and patterns that might suggest additional training is needed or other changes should be made in order to prevent accidents, the fleet management company announced.
The dashboard, available to ARI clients in the U.S. and Canada who use the ARI Accident Management program, provides details about a fleet's accident-related data with charts and graphs.
Fleet managers can study accidents by day of the week and time of day over a 12-month period, which can help fleet managers identify at-risk time periods. Fleet managers can also identify drivers with multiple incidents and the average cost per incident. The dashboard offers 14 metrics related to accident claim information.
"The ARI Accident Dashboard can adapt to whatever kind of fleet you may be dealing with, whether it is a car or light-, medium-, heavy-duty, or mixed," said Tony Candeloro, vice president for product development and client information systems for ARI. "The filters allow users to dig into the data in a variety of ways, including time of day, cost, whether the accident was determined to be preventable or not, and the type of accident (e.g., hit stationary object, hit animal, hit parked vehicle). This helps users spot trends and take action to prevent future issues. You can also filter the data by asset type or compare across different asset types. So, for example, you can choose to look at data via a specific filter – accident type, for example – and compare between the medium- and heavy-duty trucks within your fleet.”
The Accident Dashboard also gives fleet managers the ability to fairly compare accident rates among different divisions, since it can determine the number of claims per million miles driven. Previously, fleet managers were only able to compare divisions by the number of accidents that had occurred without taking into account how much each had travelled.
Accident Dashboard also tracks the costs associated with each accident, so fleet managers can identify the average and total cost of preventable and non-preventable accidents by division and can plot that information to see the trend over the past five quarters.
More Safety

Sponsored•August 1, 2026
Top 50 Executive Fleets
It is that time of year again! Time for the 2026 list of the Top 50 Executive Fleets, presented by Automotive Fleet and Volvo as part of its annual Fleet 500. Download now to see this year's list of companies!
Read More →
Sponsored•July 17, 2026
How Better Visibility Cut Speeding Violations by 48%
Fleet leaders don't need more data, they need clearer visibility into what the data is saying. This case study explores how one utility replaced speeding-event counts with a single metric — miles driven in violation — to strengthen safety and significantly reduce speeding violations.
Read More →
Operation Safe Driver Week: Why the Industry's Oldest Safety Campaign Still Matters to Fleets
A look at how a 2007 enforcement initiative became one of the most consequential weeks on the fleet safety calendar, and what it means for your drivers in 2026.
Read More →
Nexar-Nauto Merger Aims to Give Fleets Better Safety Intelligence Through Larger Driving Dataset
Stefan Heck tells Automotive Fleet that combining more than 10 billion miles of driving history with Nexar's AI models will give fleets deeper insights into driver risk and roadway conditions than either company could provide independently.
Read More →
Sponsored•July 2, 2026
From Silos to Solutions: Relationship Management for Safer Fleets
From telematics adoption and driver accountability to policy consistency and risk mitigation, this episode breaks down what it really takes to build a safer fleet culture without slowing business down.
Read More →
IIHS Launches First Commercial Vehicle Safety Evaluations
The Insurance Institute for Highway Safety has begun evaluating heavy-duty pickups and cargo vans for driver protection. Which models earned top marks?
Read More →
Reducing Risk by Eliminating Phone Use Behind the Wheel
Hosted with the cofounder of Lifesaver Mobile, this episode addresses phone use behind the wheel and how to design a driving environment that actually helps prevents accidents.
Read More →
Cameras, Safety and Insurance: From Reactive Claims to Real-Time Prevention (Part 2 of 2)
Part Two: Commercial auto remains one of the most challenging and costly lines of coverage for fleet operators and insurers alike. Continue learning more about how to effectively address these issues from Onur Aksan, Enterprise Business Development Executive, Geotab
Read More →
How 5-Second Telematics Data Is Changing Fleet Safety
This episode connects with Steve Santostasi of Ford Pro and covers how a few seconds of data can make a difference in fleet safety.
Read More →
The Two Biggest Summer Downtime Threats for Fleets
A conversation with a maintenance expert reveals the two most common summer maintenance pains and how to prevent them.
Read More →