A lifecycle cost analysis that incorporates a work vehicle’s productivity can lead to greater fleet utilization and decreased fleet spend.
Fleet management success requires an understanding of the lifecycle costs of fleet vehicles. Managers typically factor in elements such as depreciation, financing, opportunity costs, fees and taxes, fuel, insurance, and maintenance into the total cost of a fleet vehicle’s service life.
But in this new era of leveraging analytics and crunching data, do managers leave out other factors that could lead to a more accurate assessment of the lifecycle cost picture?
Analysts at Mount Laurel, New Jersey-based fleet management provider ARI say the answer is yes. They believe more accurate cost assessments require a more holistic approach. “We’re incorporating elements that we believe haven't been addressed historically to help paint a clearer picture of the actual economic performance of an asset over time,” says Mike Bryan, department head of business intelligence and analytics with ARI.
The idea is to understand the overall economic service life (ESL) of a vehicle, Bryan says, which includes concepts such as cost per unit of utilization and capacity of work or productivity. With these in mind, ARI has created its vehicle economic service life (VESL) model to help fleet operators optimize their cycling strategy. While VESL is specific to ARI, these new elements can be brought into other types of homegrown analyses.
With a greater focus on the vehicle’s productivity, fleets may not only find it advantageous to adjust their replacement schedule, but also realize higher equipment utilization. ARI analysts incorporate a vehicle’s productivity as a key component in its overall economic service life.
For example, fleet vehicle A might cost $5,000 per year to operate while vehicle B might cost $7,500 per year. Simply analyzing expenses, vehicle B is clearly more costly. However, vehicle B may be utilized more and generate twice as much revenue as unit A.
“What a simple cost analysis typically doesn’t show you is that vehicle A experiences significant downtime and isn’t nearly as productive and efficient as vehicle B,” says Ed Powell, assistant manager of business intelligence and analytics for ARI.
By focusing on vehicle economic service life, and not just lifecycle costs, Powell says fleets may identify an opportunity to reduce the number of vehicles in their fleets, which would reduce overall fleet expenditures.
Two Use Cases
Bryan offers an example of a midsize fleet in the lawn care industry which streamlined its fleet by eliminating the need to purchase 15 replacement vehicles, resulting in a reduction of nearly $450,000 in capital expenses over the next three years.
The lawn care service achieved this by identifying opportunities to increase productivity with newer, more efficient vehicles, which in turn, improved revenue generation on a per stop basis. This allowed the company to reduce its fleet size from 150 vehicles to 135 without sacrificing its revenue-generating capabilities.
Bryan also provides another example using the same productivity-based methodology. A local delivery company had been keeping its fleet of vans for longer than 48 months in service, informed by a traditional analysis of maintenance expense.
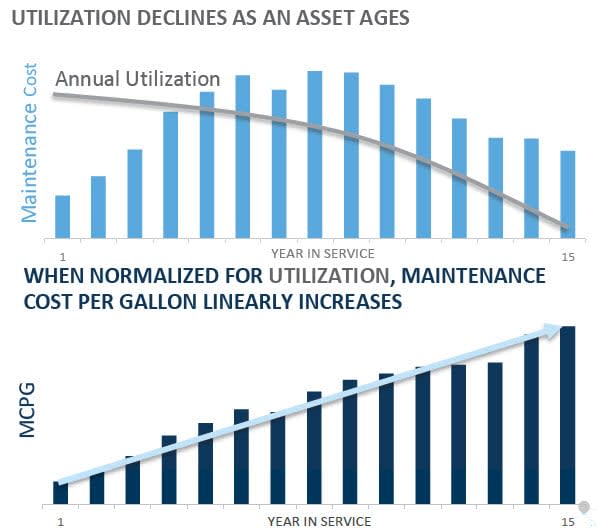
Using the new methodology, the company discovered that by keeping the vans longer than 48 months in service, the average maintenance cost per gallon of fuel burned — a better measure of productivity — increased by 138%.
Based on this analysis, the delivery fleet began replacing vans at the 48 months threshold. Through one replacement cycle, the fleet’s average maintenance cost per unit dropped $668 from $3,879 to $3,211.
ARI’s analysts say most fleets regardless of size can achieve similar results using this more holistic methodology for vehicle asset acquisition.
Factoring Productivity
This approach offers a distinct alternative to a traditional replacement strategy, which often uses year and/or mileage thresholds to establish replacement parameters but typically does not account for a key element of the equation — utilization. The methodology ARI is championing delivers a more holistic view, helping fleets establish replacement thresholds based the data and facts of their specific operating conditions.
Bryan says an ESL method uses a cost per unit of utilization such as per-mile driven, gallon of fuel consumed, or hour of engine operation. The method — which also takes into consideration other factors such as productivity, generated revenue, and the company’s need to optimize its capital expense budget — can be applied to equipment such as forklifts and bulldozers as well as passenger cars and light- to heavy-duty trucks.
Bryan says ARI’s method builds upon a widely accepted financial model employed in many capital-intensive industries such as the construction and airline sectors. It works best when fleets incorporate telematics data as part of the analysis. Why is that? As fleet managers examine miles driven, fuel consumed, or engine hours operated, the numbers can be more easily associated with each vehicle’s actual productivity or the revenue it generates.
“A lot of fleets think that as their assets age, they got cheaper to operate,” Bryan says.
However, as an ESL model looks more closely at the actual revenue generated or amount of work being done by each asset per gallon of fuel burned, for example, it reveals that older models are actually doing less work than newer ones, costing more to achieve similar levels of productivity. It’s not uncommon to find older vehicles used as reserve units because of their unreliability, Bryan adds.
Bathtub Curve
Ed Powell, assistant manager of business intelligence and analytics for ARI, says ESL methodology is not meant to explain why the productivity of a particular asset declines, but rather to simply call out the fact that its productivity is declining and to factor that into the equation of determining its cost per unit of work.
That calculation allows fleets to determine if the cost of productivity or utilization for that asset is extraordinarily higher than other brand new or newer assets, and if so, highlighting those units for potential replacement or perhaps even elimination from the fleet.
“Year one, you may be spending more on depreciation and capital costs, and a smaller portion on operating costs,” Powell says. “Whereas that formula ends up flipping as the vehicle ages. What you end up with is what we call a bathtub curve.”
Bryan says for fleets with constrained capital budgets, they may need assets that can help stretch that capital budget further. Consequently, they may make decisions that ultimately results in higher operating costs.
They may determine that a more robust PM strategy helps offset some of those higher operating costs as the assets get older, thus allowing them to keep the assets longer and reduce their capital expenses, he says.
An ESL model determines at which point the average annual cost of an asset will start to rise and intersect with the asset’s declining resale value and cash flow, Powell says. Using that information, fleets can then replace that asset before its costs overtake the asset’s value and generated revenue.
“This process allows fleet managers to have conversations with their maintenance and finance counterparts and have all of their concerns taken into consideration,” Powell says.
Powell outlines the concerns for each part of an organization: The finance team may be concerned with total cost and the cost of capital, he says. Whereas procurement’s focus may be on the asset’s cost of acquisition and resale value. Separately, maintenance is likely concerned about rising operating costs. Drivers are concerned about performance and reliability of the asset.
“This model encompasses all of those viewpoints of the various fleet stakeholders and finds a level playing field where they can discuss what optimum looks like and what strategies can be employed to help move the fleet closer to that ideal state,” Powell says.