

How Much Per Mile - AF's Operating Cost Survey
Cost-per-mile figures are important, but don't overlook other considerations
The No. 1 job of every fleet administrator is to control fleet costs.
Indeed, the only reason for a fleet operator's job is to control costs. While he is necessary for the smooth functioning of a fleet, expediting vehicles in an orderly fashion, taking the guesswork out of purchase and replacement and handling claims and paperwork, top management looks at the fleet administrator primarily as a cost control expert.
Because of this pre-occupation with costs, too much emphasis is sometimes placed on cost: per mile figures, often to the detriment of over-all fleet operations. While cost-per-mile figures are probably as good a guideline as there is for evaluating fleet operating costs, or for determining which particular make of car can be expected to operate at the lowest possible cost, such figures have little value over the long run.
Sound redundant? Well, it's not if you stop to consider what cost-per-mile figures really mean.
Cost-per-mile figures generally include both fixed costs-insurance and depreciation-and variable costs -gasoline, maintenance and tire repair and replacement. From these figures, fleet administrators are supposed to draw yardsticks as to the cost-per-mile for vehicle operation.
AUTOMOTIVE FLEET feels that one important factor is being overlooked in such evaluations. All costs are variable, and as a result it is difficult to correlate figures from one year to the next. Obviously, all auto manufacturers know when their cars are operating at a higher rate than a competitor's and they are quick to take action to remedy the competitive disadvantage. Thus, the conditions which result in poor operating costs for a particular make of car may have been completely changed or re moved by the next model year, making a comparison with the previous year's model invalid.
More important, general economic conditions, which affect the used car market, improved fuels and lubricants and other contributing factors make it impractical to rely on one year's fleet performance as the only basis for determining the following year's fleet policies.
This has never been more true than it is today with increased warranties, mechanical refinements and long-life features being offered by all auto companies. Not to mention the guaranteed depreciation programs aimed at improving the resale value of various makes.
CONDITIONS NOT THE SAME
There is also little reason for comparing the cost- per mile figures of one company with another, even one in the same industry. Such figures have little value unless all things are equal. And there are very few fleets that operate under identical conditions. Not many fleets buy the same make of cars with identical equipment, distribute them the same way, put on the same amount of miles and turn in their cars at the exact same time.
It is also difficult to reconcile the cost-per-mile figures of salesmen-owned cars, company cars or leased cars. When analyzing company ears against leased cars, it is generally overlooked that leasing companies project rates into the future while company- owned figures generally reflect past results.
Also, leasing figures include the leasing company's profit, overhead, administrative expenses, and interest on invested capital while company owned fleet operations generally exclude such figures.
When comparing salesman ownership, little thought is given to the fact that under company ownership, the company often pays for every mile driven while under salesman ownership, the company is responsible only for business miles driven. With this in mind, cost-per-mile figures under salesman ownership should be calculated higher than company ownership that is computed on a strict cost-per-mile to the company basis.
It is also obvious that high-mileage fleets have a distinct advantage over low-mileage fleets in computing costs. The more miles a car puts on, the lower the cost-per-mile figures. This is the reason that some advertised leasing quotes appear so low-they are based on extremely high mileage.
Another element to be considered in determining cost-per-mile figures is the fringe benefit. It is easy to reduce operating costs by using stripped down, bottom line models that are almost bare of equipment. While this may make the fleet administrator look good on paper, he is actually cheating himself and his company. The lack of quality and convenience is the easiest way to reduce driver efficiency. And efficiency, especially in the case of a salesman, can be translated into increased company profits.
Cutting cost figures to the bone can also result in increased costs in the future in the form of higher insurance rates and maintenance expenses.
The two biggest factors in fleet costs are controlling depreciation and gasoline expenses. Together, these two costs generally make up about 70 per cent of fleet ownership and operating costs.
Buying low and selling high results in low depreciation. The first part of the formula is relatively easy; the second is a little harder. A utility, for example, can normally buy low and lengthen out its use cycle when company maintenance shops are used. It stands to reason that the longer a vehicle is held, the lower the depreciation factor. Fleets that trade their vehicles every year or two must pay great attention to depreciation. It is the job of the fleet manager to keep a close watch on the used car market. If used car prices are soft, it might pay the fleet manager with a 1,000 cars or more to keep his cars until the market firms up. Naturally, this would result in increased costs- either in maintenance or from supporting two fleets- but the savings in the long run generally will offset the additional expense. To avoid this pitfall, AUTOMOTIVE FLEET recommends that fleets dispose of their cars at different times of the year-but never after late spring. By spreading out the replacement cycle, the changing market: conditions are clown played. Most of the large leasing companies in the country operate under a continuous nine-month replacement program.
Fleets with full service maintenance shops have no problem with the cost of gasoline-the cars are filled at the garage. Under salesman ownership and with scattered fleets, a flexible method is often best.
Sam Lee, West Coast leasing authority, recently said that "top management would do well to recognize that unless the reports it receives from the fleet manager are translated into terms of cost-per-dollar of sales rather than cost-per-mile, it is receiving information which is of little or no practical value."
While Lee makes a strong point, under present conditions it is almost impossible to translate cost-per-mile into cost-per-dollar of sales. Also, there are many fleets which are not concerned with sales, such as police departments, government agencies and utilities.
AUTOMOTIVE FLEET feels that fleet administrators should work hard to convince their top management that while cost-per-mile figures are important to over-all fleet operations, they should not be considered to the exclusion of all other factors. When a company treasurer hears that another fleet is operating at a much lower cost, he must be made to realize that possibly other factors are involved. And fleet administrators should not be forced to spend all of their time computing cost-per-mile figures to the detriment of other areas of fleet administration. If cars are traded every year, with variance in makes and models, cost-per-mile figures lose much of their meaning.
Fleet costs of State Farm Mutual Insurance Co. show the variables involved in controlling over-all costs.
Willis O. Sehueth, superintendent of State Farm's fleet, told AUTOMOTIVE FLEET that total fleet costs for 1962 were down $65,512 over the previous year. Operating cost savings amounted to $31,196 with the rest coming from a reduction in fixed or non-controllable costs.
COST REDUCTION TIPS
"The importance of the management and development of detailed costs of fleet operation is well illustrated in the summaries," Sehueth said.
Sehueth outlined some basic guidelines that will improve fleet operation and reduce costs:
Regular inspection of oil filter cap vents and exhaust dampers.
Maintaining proper temperature thermostats.
Check oil condition for the presence of sludge by looking through the oil filter opening in the valve cover.
Prompt repair of leaking oil seals.
Maintenance of correct toe-in of front wheels.
"These are simple, easily performed, inexpensive inspections vital to cost control which will result in continued decrease in operating costs," Sehueth said.
Sehueth said that all operating costs except oil and engine repair declined in 1962. For each 1,000 miles driven, oil costs increased 1 cent and engine repair costs increased 6 cents. The wider use of higher priced premium oil and an unusually severe weather which necessitated adding or changing to lighter weight oil were blamed for the increased oil costs.
"The weather also appeared to be a factor in the costs for motor and mechanical repairs," Sehueth said. "Other factors were the sludge problem brought about by substandard quality premium priced oils, the ventilation restriction in Chevrolet crankcases, minor repairs necessary to drive a car 65,000 miles because of our policy change and excessive charges for small repairs."
Compared to an increase of 10 per cent in miles driven, oil costs for the State Farm fleet increased 12.4 per cent while repair costs were up 15 per cent. Thus, costs increased 2.39 per cent for oil and 1.89 per cent for repairs over the increase in the number of miles operated.
DEPRECIATION UP
All non-operating costs decreased with the exception of depreciation, which was up 4.56 per cent, primarily because of an accounting change. A straight line schedule of 2 per cent per month depreciation was started in January, 1962, compared to the previous 2 per cent for the first 12 months, PA per cent for the next 12 month and 1 per cent thereafter. Actual depreciation totaled $25.70 per 1,000 miles compared to the accounting reserve depreciation of $25.00 per 1,000 miles.
Sehueth said that had the company's 1958 cost-per- mile figure prevailed in 1962, $281,536 more would have been spent for fleet operations last year.
"The continued increase in the use of compact cars should result in lower operation costs," Sehueth said. State Farm had 657 compacts in its fleet at the close of 1962. The company has more- than 2,000 cars.
The State Farm fleet put on 51,993,763 miles in 1962, up 10 per cent over 1961. Gasoline to keep the fleet rolling cost $1,026,356, up 8.6 per cent over the previous year. However, the cost of gasoline per mile was down 15 per cent to .0197, resulting in a cash savings of $15,598.
Miscellaneous fees such as licenses and taxes totaled $56,153, clown .16 per cent from 1961. Insurance amounted to $203,815 a decrease of 3.31 per cent. The cost of motor oil amounted to $24,437, up 12.40 per cent. Engine and mechanical repairs cost $155,- 461, up 11,50 per cent while miscellaneous expenses for grease, tires, batteries and other accessories, storage and cleaning totaled $214,214, up .49 per cent.
STATE FARM DEPRECIATION COSTS
NUMBERS OF CARS SOLD | PURCHASE COST | SALE OR TRADE-IN | DEPRECIATION | MONTHS OWNED | MILEAGE WHEN SOLD | AVERAGE DEPRECIATION PER MONTH | AVERAGE DEPRECIATION PER MILE | |
|---|---|---|---|---|---|---|---|---|
STANDARD#1 | 29 | $69,128 | $24,726 | $44,402 | 793 | 1,494,100 | 55.99 | 0.0297 |
STANDARD#2 | 436 | $982,749 | $394,903 | $587,846 | 12,348 | 21,140,900 | 47.61 | 0.0278 |
STANDARD#3 | 421 | $961,584 | $515,490 | 11,750 | 21,005,500 | 43.87 | 0.0245 | |
COMPACT #1 | 24 | $51,974 | $21,246 | $30,728 | 764 | 1,191,500 | 40.22 | 0.0258 |
COMPACT #2 | 6 | $12,714 | $6,100 | $6,614 | 168 | 273,100 | 39.37 | 0.0242 |
COMPACT #3 | 3 | $5,992 | $2,926 | $3,066 | 84 | 124,000 | 36.5 | 0.0247 |
COMPACT #4 | 4 | $8,561 | $3,107 | $5,454 | 130 | 171,700 | 41.95 | 0.0318 |
COMPACT #5 | 2 | $3,524 | $1,945 | $1,579 | 59 | 95,600 | 26.76 | 0.0165 |
COMPANY TOTAL | 925 | $2,096,226 | $928,547 | $1,167,679 | 26,096 | 45,496,400 | 44.75 | 0.0257 |
As an illustration of how State Farm has reduced fleet costs, Schueth gave AUTOMOTIVE FLEET a five year breakdown of both operating and non-operating costs:
OPERATING COSTS (Percentage Measured Against Previous Years)
Year | Cost Per Mile | Miles Operated | Increase | Decrease |
|---|---|---|---|---|
1958 | 0.0332 | 33,340,1.19 | 5.00% | |
1959 | 0.0316 | 37,514,578 | 4.8.1% | |
1960 | 0.0297 | 42,533,051 | 6.02% | |
1961 | 0.0279 | 47,264,761 | 6.07% | |
1962 | 0.0273 | 51,993,763 | 2.15% |
Operating costs include gasoline, oil, greasing, repairs, tires, batteries, accessories, cleaning and storage.
NON-OPERATING COSTS
YEAR | Cost Per Mile* | Increase | Decrease |
1958 | 0.00626 | 6.28% | |
1959 | 0.00602 | 3.83% | |
1960 | 0.00658 | 9.30% | |
1961 | 0.00646 | 1.82% | |
1962 | 0.0058 | 10.22% |
*Less depreciation
Non-operating costs include claims, liceses, taxes, and insurance.
TOTAL COSTS
YEAR | COST PER MILE | INCREASE | DECREASE | CASH SAVINGS |
|---|---|---|---|---|
1958 | 0.0394 | 5.00% | ||
1959 | 0.0379 | 3.80% | $56,271 | |
1960 | 0.0363 | 4.23% | $68,058 | |
1961 | 0.0343 | 5.51% | $91,693 | |
1962 | 0.0331 | 3.67% | $65,512 | |
*Present year mileage multiplied by cost differential of present and previous year.
Depreciation was not included in the total cost figures. Actual cash depreciation in 1960 was $43.45, or .0252 per mile. In 1961, depreciation amounted to $45.85 per month, or .0266 per mile. Last year, depreciation totaled $44.75 per month, or .0257 per mile.
Taxi and police fleets are probably the most expensive types to operate because of the heavy pounding that the cars take. The cost of operating a police fleet is expensive, but the costs can be controlled.[PAGEBREAK]
Capt. H. H. Schaperkotter, head of the motor equipment division of the Missouri State Police, gave AUTOMOTIVE FLEET a complete report on the total fleet costs for the fiscal year ended June 30, which gives a clear insight to the expenses involved in keeping state police cars rolling.
Schaperkotter said that the total operating costs for Missouri's entire fleet of passenger cars amounted to $444,441. Based on a total of 14,013,814 miles driven, this averaged out to .03.17 cents per mile. Operating costs included gasoline, oil, lubrication, washes, tires and mechanical repairs.
In a further breakdown of operating costs, Schaperkotter said that a total of 1,171,798 gallons of gasoline were purchased during the year with an average miles-per-gallon figure of 12. Maintenance and repair expenses totaled $107,297, or .0077 per mile.
Repairs due to accidents amounted to $11,428, or .000802 per mile driven. A total of 100 cars were involved in accidents during the year with the repairs for 37 ears paid for by insurance companies of the other drivers involved. This amounted to $3,969. Six cars were traded rather than repaired which resulted in $8,006 of the expense to the department for accidents being included in the amount to replace cars.
During the year, 377 cars and light trucks were replaced at a cost of $406,272. Based on a total mileage of 16,499,846 miles, the replacement costs amounted to .024623 per mile.
During the year, the Missouri police acquired 75 to 100 cars with a 122 or 123 inch wheelbase, on which cars with a 119-inch wheelbase were traded. The additional cost of these more expensive cars helped to boost replacement costs, Schaperkotter said.
Schaperkotter said that the Missouri Stale Police don't have to be shown the merits of car reconditioning before trading. With police cars, reconditioning expenses are more than offset by increased trade- in values, he said.
Expenses for replacement of broken glass, excessively deteriorated upholstery, repair of minor body damage and other miscellaneous expenses amounted to $10,478, or .000635 cents per mile for the 16,499,- 846 miles on the replaced vehicles.
Windshields replaced accounted for nearly 80 per cent of the reconditioning costs, amounting to $8,009. Bumper and grille moldings replaced totaled $736; minor body damage repairs, $244; upholstery re paired, $554; reconditioning of tires, $767; and miscellaneous expenses, $167.
Costs of new car servicing, installation of police equipment, stripping and servicing of replaced cars amounted to $19,142 in labor expenses.
Schaperkotter broke down the replacement labor costs in the following manner:
Six hours new car servicing at $2.50 per hour | $15.00 |
Six hours new car equipment at $2.50 per hour | $15.00 |
One hour reconditioning police equipment at $2.50/hour | $2.50 |
Four hours stripping and inspecting replaced car at $2.50/hour | $10.00 |
TOTAL | $42.50 |
377 cars at $42.50 each | $16,022.50 |
One-half garage foreman's salary | $ 3,119.94 |
TOTAL LABOR COSTS | $19,142.44 |
The average cost per mile for labor replacement expenses amounted to .001160 cents.
Expenses for various minor items connected with car replacement and maintenance programs amounted to $3,401. This covered wire, wire connectors, drill bits, screws, shop towels, paint, wheel weights, tool repairs, valve caps, grease, tape and other miscellaneous used in the garage.
Considering all factors, the Missouri State Police spent $901,965 last year, or .059084 cents per mile, to operate its fleet of ears and trucks. Judging from other police department figures available to AUTO MOTIVE FLEET, this is a very low operating cost. Operating costs exceeded car replacement or depreciation costs by nearly $50,000.
A breakdown of the Missouri State Police costs show:
Operating Costs | $451,241.65 | .031658 |
Loss From Collisions | $11,428.21 | .000802 |
Car Replacement Cost | $106,272.80 | .024623 |
Reconditioning Cost | $10,178.87 | .000635 |
Servicing, equipping, stripping new and used cars | $19,142.44 | .001160 |
Miscellaneous Expenses | $3401.71 | .000206 |
TOTAL | $901.965.71 | .059084 |
Not included in the total costs were administration and clerical salaries and overhead expenses for garage facilities.
Schaperkotter said that the operating expenses were computed on a per mile basis based on the actual miles driven by the fleet while the cost of replacement was computed on a per mile basis of the mileage on the vehicles when traded.
The Missouri State Police uses a mixture of cars including Buick, Chevrolet, Chrysler, Dodge, Ford and Oldsmobile. The oldest: ears in the fleet are 1959 models.
The best gasoline mileage was turned in by 1963 Chevrolet models with a 327-cubic inch engine-15.2 m.p.g. The lowest miles per gallon of gasoline was recorded by 1961 Ford station wagons with a 352- cubic inch engine-9.7 m.p.g.
The best record on maintenance and repair expenses per mile was recorded by 1963 Chevrolets with the 327-cubic inch engine and 1963 Dodge station wagons with a 383-cubic inch engine. Both cars averaged .0013 per mile. The highest mile per cost for maintenance and repairs was recorded by 1959 Dodge station wagon models with a 383 cubic inch engine-.0210 per mile.
Over-all, 1963 Oldsmobile models with a 215-cubic inch engine had the lowest operating cost-.0162 per mile, while the 1959 Dodge station wagons cost the most to operate-.0419 per mile.
Schaperkotter pointed out that the newer cars in the fleet, which have been operating in the low mileage range, operate cheaper than the older models which are in the higher mileage range. Older cars have greater maintenance and tire repair expenses. Also the high and low averages for each classification can be distorted by the total number of cars and total mileage involved.
More Operations
How to Manage Conflict for Your Fleet Operations
Conflict management is becoming a core leadership skill. Here are five strategies fleet leaders should know.
Read More →
Turning Connected Vehicle Data Into Decisions That Matter
Fleet leaders have more data than ever, but turning that data into clear, actionable decisions remains a challenge. This white paper shows how leading organizations are using connected vehicle data to improve safety, reduce costs, and optimize fleet performance. Learn how to turn insight into action across your fleet.
Read More →
Cameras, Safety and Insurance: From Reactive Claims to Real-time Prevention
Commercial auto remains one of the most challenging and costly lines of coverage for fleet operators and insurers alike. Learn more about how to effectively address these issues from Onur Aksan, Enterprise Business Development Executive, Geotab.
Read More →
Are You Tracking Your Fleet's True Total Cost of Ownership?
Bobit Business Media surveyed 190 fleet professionals and found that while most fleets are tracking costs, fragmented systems and data gaps are keeping true TCO visibility out of reach. With rising pressure to control spend in an increasingly volatile environment, the gap between what fleets think they know and what the data actually shows is wider than you might expect. See how your peers are managing costs today and where the industry still has room to improve.
Read More →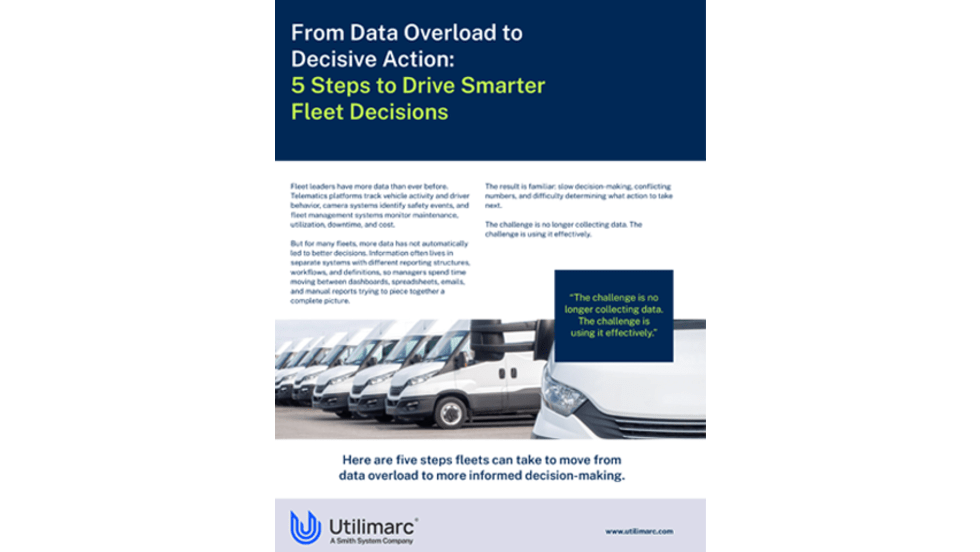
Turn Fleet Data Into Smarter Decisions
Fleet leaders have access to more operational data than ever, but disconnected systems and unclear metrics often slow decision-making instead of improving it. This article outlines five practical steps fleets can take to transform fragmented data into actionable insights that improve planning, safety, utilization, and long-term performance.
Read More →
Hybrids: Electrification Without the Challenges
For fleet managers, fuel is one of the biggest line items in the budget — and it's one hybrids can shrink without changing how your people work. Download the eBook to see the numbers, understand the technology, and get a step-by-step guide to making the switch.
Read More →
How NOV Uses Telematics to Improve Fleet Safety Across 160 Locations
James Victory of NOV discusses how the company manages fleet safety, maintenance, and telematics across more than 150 locations supporting oilfield operations throughout the U.S.
Read More →
Fleet Meets: Steven Santostasi
This edition of the Fleet Meets series features Steven Santostasi, the current TSP channel manager for Ford Pro.
Read More →
Why Fleet Managers Are Replacing Departmental Vehicles with Shared Motor Pools
Departmentally assigned vehicles often create hidden costs through underutilization, poor visibility, and increased administrative burden. This white paper explores how shared motor pool strategies help fleets reduce costs, improve accountability, and optimize vehicle utilization.
Read More →
Soap Box Derby Challenge: Assembling the Crew
Meet Gabriel, Matthew, and Angel — the team helping bring this soap box derby build to life.
Read More →