

Gasoline Costs Climb 215%
From 1936 to 1975 the cost of gasoline rose 215% (from 19.1 cents to 60.1 cents per gallon) in 10 United States cities.
From 1936 to 1975 the cost of gasoline rose 215% (from 19.1 cents to 60.1 cents per gallon) in 10 United States cities. Over one-half of the increase occurred since 1973 (during the past 2-½ years).
The following table provided by Runzheimer and Company, Inc., shows a twenty-one year history of regular grade (fully leaded) gasoline prices in the 10 cities.
CITY | 1954 | 1964 | 1973 | 1974 | 1975 |
Boston, MA | 27.9 | 28.9 | 38.9 | 55.7 | 59.4 |
New York, NY | 27.9 | 32.9 | 45.8 | 60.7 | 68.1 |
Chattanooga, TN | 32.4 | 32.7 | 37.9 | 54.3 | 60.2 |
Chicago, IL | 29.5 | 33.9 | 37.9 | 57.3 | 62.8 |
Dallas, TX | 26.1 | 28.9 | 34.9 | 50.9 | 56.2 |
Denver, CO | 29.0 | 32.2 | 38.9 | 56.9 | 60.1 |
Los Angeles, CA | 28.6 | 32.5 | 38.9 | 56.3 | 57.2 |
Miami, FL | 28.9 | 32.9 | 37.9 | 56.9 | 58.9 |
St. Louis, MO | 27.9 | 28.9 | 38.9 | 55.9 | 59.4 |
Seattle, WA | 31.1 | 32.9 | 38.9 | 58.4 | 58.5 |
Average Price | 28.9 | 31.7 | 38.9 | 56.4 | 60.1 |
More Operations
How to Manage Conflict for Your Fleet Operations
Conflict management is becoming a core leadership skill. Here are five strategies fleet leaders should know.
Read More →
Turning Connected Vehicle Data Into Decisions That Matter
Fleet leaders have more data than ever, but turning that data into clear, actionable decisions remains a challenge. This white paper shows how leading organizations are using connected vehicle data to improve safety, reduce costs, and optimize fleet performance. Learn how to turn insight into action across your fleet.
Read More →
Cameras, Safety and Insurance: From Reactive Claims to Real-time Prevention
Commercial auto remains one of the most challenging and costly lines of coverage for fleet operators and insurers alike. Learn more about how to effectively address these issues from Onur Aksan, Enterprise Business Development Executive, Geotab.
Read More →
Are You Tracking Your Fleet's True Total Cost of Ownership?
Bobit Business Media surveyed 190 fleet professionals and found that while most fleets are tracking costs, fragmented systems and data gaps are keeping true TCO visibility out of reach. With rising pressure to control spend in an increasingly volatile environment, the gap between what fleets think they know and what the data actually shows is wider than you might expect. See how your peers are managing costs today and where the industry still has room to improve.
Read More →
Turn Fleet Data Into Smarter Decisions
Fleet leaders have access to more operational data than ever, but disconnected systems and unclear metrics often slow decision-making instead of improving it. This article outlines five practical steps fleets can take to transform fragmented data into actionable insights that improve planning, safety, utilization, and long-term performance.
Read More →
Hybrids: Electrification Without the Challenges
For fleet managers, fuel is one of the biggest line items in the budget — and it's one hybrids can shrink without changing how your people work. Download the eBook to see the numbers, understand the technology, and get a step-by-step guide to making the switch.
Read More →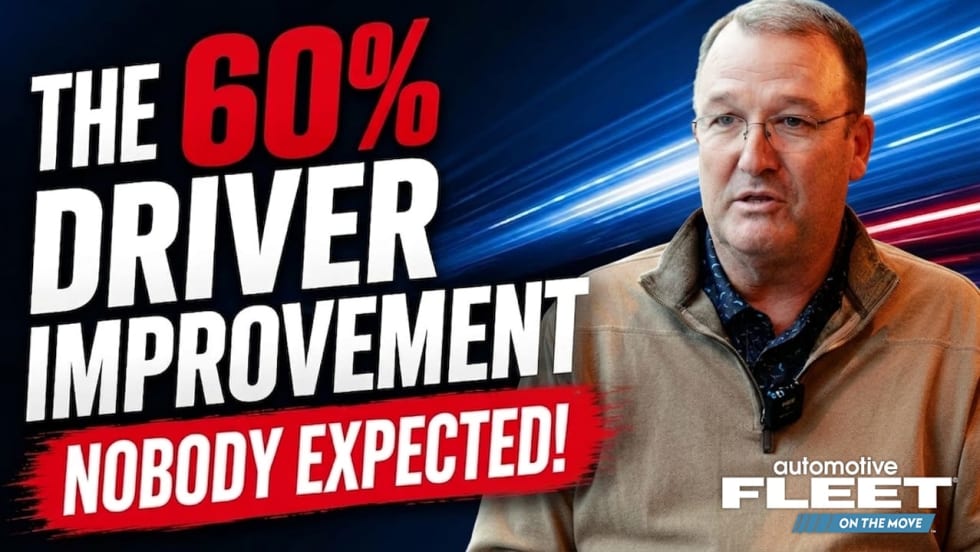
How NOV Uses Telematics to Improve Fleet Safety Across 160 Locations
James Victory of NOV discusses how the company manages fleet safety, maintenance, and telematics across more than 150 locations supporting oilfield operations throughout the U.S.
Read More →
Fleet Meets: Steven Santostasi
This edition of the Fleet Meets series features Steven Santostasi, the current TSP channel manager for Ford Pro.
Read More →
Why Fleet Managers Are Replacing Departmental Vehicles with Shared Motor Pools
Departmentally assigned vehicles often create hidden costs through underutilization, poor visibility, and increased administrative burden. This white paper explores how shared motor pool strategies help fleets reduce costs, improve accountability, and optimize vehicle utilization.
Read More →
Soap Box Derby Challenge: Assembling the Crew
Meet Gabriel, Matthew, and Angel — the team helping bring this soap box derby build to life.
Read More →