

Building the Next-Generation Driver Scorecard
Driver scorecards lead to targeted intervention, which can involve either informal coaching or formal training or a combination of the two.
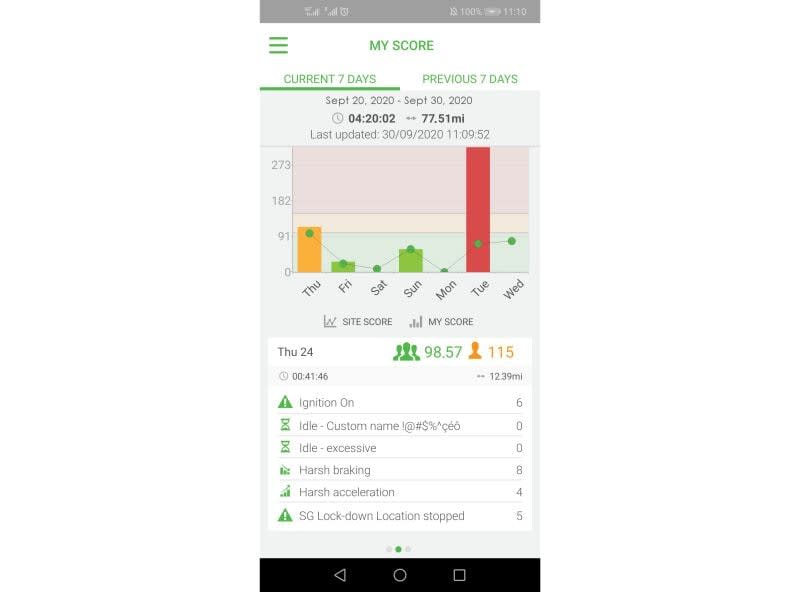
Photo: Mix Telematics
Even though the amount of data available to fleet and driver managers is increasing, the challenge of identifying risky and inefficient driving behavior and targeting interventions remains.
Risky and inefficient driving behavior is vital to manage because of the negative impact on operating costs and profitability due to it resulting in accidents, poor fuel economy, increased maintenance, and decreased customer satisfaction.
What are Driver Scorecards?
The core of any proactive, safety and efficiency-focused driver performance improvement plan is data management. Specifically, acquiring the relevant data and deriving insights from it can help managers and drivers to:
Understand the big picture of driver performance within their operation.
Identify problem trends as they develop across the driver population.
Narrow their focus to specific problem drivers.
Identify positive or negative trends for specific drivers.
Target specific interventions for each driver.
Get a sense of whether their interventions are effective or not.
Telematics data presented in the form of a driver scorecard has been a key enabler of proactive driver performance management. Traditionally, this has involved measuring safety-focused KPIs with the understanding that improving these KPIs will result in a positive impact on driving efficiency. Typical safety-focused KPIs include speeding, harsh acceleration, harsh braking, and harsh cornering, all of which are unnecessary if the driver is demonstrating appropriate situational awareness.
Driver scorecards lead to targeted intervention, which can involve either informal coaching or formal training or a combination of the two. The driver scorecard KPIs can quickly identify the specific problem and the type of intervention needed. For example, in the case of harsh braking, the driver needs to focus on his/her scanning, hazard perception, and anticipation skills. This approach reduces the amount of effort needed from both the driver and driver manager, reducing the negative impact on the overall efficiency and productivity of the transport operation.
Changes in Driver Scorecards
Over the last few years, we have seen a significant increase in the amount of data that is available for measuring driver performance and implementing targeted interventions. These new types of events once detected on the mobile device or through machine vision-enabled cameras, are then processed by driver scoring algorithms in the fleet management system.
In addition to the traditional safety-focused KPIs, mobile apps now allow us to detect the risky behavior of phone use while driving. Reports from The National Safety Council reports that this type of distraction leads to 1.6 million crashes every year in the United States alone. It is also easier to measure fuel consumption and attribute it to a specific driver. This helps to build up a profile of how efficiently they drive and provides an explicit indication of fuel-efficient driving as opposed to the traditional inference from safety-related KPIs.
However, one of the most important emerging technologies impacting driver performance management is machine vision. In-vehicle cameras with machine vision capability allow for the detection of driver behavior events such as:
Fatigue.
Distraction as a result of:
Mobile phone use.
Eating.
Smoking.
Passenger activity.
External activity.
Not using a seatbelt.
Forward collision warnings.
Lane departure without indicating.
The addition of these types of events to the existing driver scorecard events will provide a more holistic view of driver behavior and give insights into cause and effect. For example, the combination of a forward collision warning event with a harsh braking event can indicate that the driver was distracted and thus paints a much clearer picture of cause and effect, allowing for a better understanding of how to solve the problem.
In practical terms, machine vision technology has resulted in the driver scorecard helping the driver and driver manager start at the high level and drill down to specific coachable moments.
How to Balance Your Driver Scorecard Approach
To date, the focus on safety-related risky driving behavior has resulted in a driver scorecard approach, which is imbalanced. Having a more balanced driver scorecard will reflect how all of a driver’s activities impact the business as well as customers if the information is being presented in a meaningful way. A balanced scorecard has the ability to bring together safety, compliance, and efficiency data.
So far, the story has focused on safety but only briefly touched on efficiency. There are multiple dimensions to measuring efficiency:
Fuel efficiency.
Business process efficiency (e.g., on-time departure and arrival for service delivery).
Maintenance efficiency (e.g., the impact poor driving has on vehicle wear and tear).
A relatively neglected area within a fleet is compliance, something that is more focused on heavy vehicles. The two main compliance activities a commercial heavy vehicle driver undertakes are vehicle inspections and fatigue management (using Hours of Service). Compliance can also extend to violation infringements such as unsafe loads, speeding, failure to do a vehicle inspection, or failing to meet ELD/HOS regulations.
Failing to conduct an inspection, missing a defect that results in a roadside breakdown, or being put out of service due to a HOS violation can have a significant impact on operating costs, productivity, and customer experience. These activities can be measured with KPIs, which can be incorporated into the driver scorecard to provide balance.
Striving for a balanced scorecard can result in multiple technical challenges:
Identifying and collecting all relevant data from telematics devices, cameras, mobile apps, customer systems, and external systems.
Identifying and collecting other data that can be used to provide context (e.g., environmental information such as weather, traffic congestion, accident hotspots, and so forth).
Achieving flexibility in how the data is analyzed and combined to show driver performance in a meaningful and easily understandable way (e.g., how it impacts on the business, customers, the environment, and the driver).
Being able to derive actionable insights that help the driver and driver manager quickly identify and address problem areas with minimal effort.
These technical challenges can only be overcome with a data-driven approach and the application of emerging and advanced software technologies, including advanced analytics, machine learning, and artificial intelligence.
In summary, the combination of data availability, emerging data management, and processing technologies will allow for a more comprehensive and balanced view of driver performance to be made available to drivers and driver managers. The resulting data-driven insights and interventions will result in improving positive outcomes for the driver, company, customers, and other vehicles on the road.
About the Author: Glen Mitchell is Product Strategist at MiX Telematics. He has an extensive experience in the application of technology to solve business problems in the transport operations. Prior to joining MiX Telematics, Mitchell was Chief Information Officer for a large public transport operator in Australasia and, more recently, product lead for safety and compliance solutions at MiX Telematics.
Originally posted on Work Truck Online
More Global Fleet

The Top 300 Commercial Fleets
The Top 300 Commercial Fleets: See the List
Read More →

Cameras, Safety and Insurance: From Reactive Claims to Real-Time Prevention (Part 2 of 2)
Part Two: Commercial auto remains one of the most challenging and costly lines of coverage for fleet operators and insurers alike. Continue learning more about how to effectively address these issues from Onur Aksan, Enterprise Business Development Executive, Geotab
Read More →

Cameras, Safety and Insurance: From Reactive Claims to Real-time Prevention
Commercial auto remains one of the most challenging and costly lines of coverage for fleet operators and insurers alike. Learn more about how to effectively address these issues from Onur Aksan, Enterprise Business Development Executive, Geotab.
Read More →
Why Fleet Managers Are Replacing Departmental Vehicles with Shared Motor Pools
Departmentally assigned vehicles often create hidden costs through underutilization, poor visibility, and increased administrative burden. This white paper explores how shared motor pool strategies help fleets reduce costs, improve accountability, and optimize vehicle utilization.
Read More →
Fleet Costs Are Rising: Here’s How Leaders Are Responding
Fleet leaders are under pressure to reduce costs, adapt to economic uncertainty, and make smarter decisions. See how peers across North America are responding with real data, proven strategies, and forward-looking insights. Download the 2026 Market Pulse Report to benchmark your strategy and uncover where you can gain an edge.
Read More →
Enterprise Fleet Management Surpasses 900,000 Vehicles in U.S. & Canada
Enterprise Mobility connects with mobility solutions around the globe
Read More →
Automotive Fleet's Guide to Fleet Electrification
Unlock the secrets to a successful transition to electric fleets with Automotive Fleet's comprehensive Fleet Electrification Guide!
Read More →
Sumitomo Rubber Industries to Acquire Viaduct
Viaduct will join Sumitomo as an independent subsidiary. Partnership strengthens global reach and accelerates AI-driven innovation for fleets and manufacturing.
Read More →
AfMA’s 2025 Education & Leadership Summit: 26 Years of Impactful Connection
Held in Sydney, the Australasian Fleet Management Association’s 2025 Summit marked ten years of growth as the event expanded its global reach and doubled down on practical, non-commercial fleet leadership programming.
Read More →