


Related: Improving Driver Retention Practices During a Pandemic
Roadway Fatalities Rise 18.4% in First Half of 2021
New data from the National Highway Traffic Safety Administration paints a grim picture of our nation’s roadways.
November 1, 2021
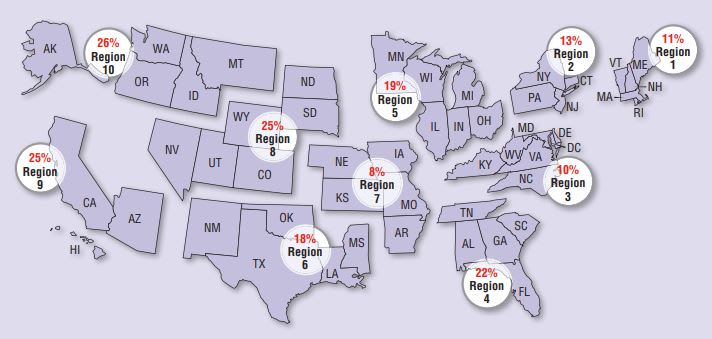
This chart shows percentage change in estimated fatalities in the first half of 2021 from estimated fatalities in the same half of 2020, by NHTSA region.
Image courtesy of NHTSA.
3 min to read
Approximately 20,160 people lost their lives in motor vehicle crashes in the first half of 2021, up 18.4% over 2020 and the largest number of projected fatalities in that time period since 2006.
The National Highway Traffic Safety Administration released the new data on Oct. 28, and the reaction was grim. The National Safety Council released a statement saying the fatality estimates “paint a dark picture of the state of safety on our nation’s roadways.” United States Transportation Secretary Pete Buttigieg called the traffic deaths “a crisis” that we cannot and should not accept as simply a part of everyday life.
Rounding out the roadway picture and adding further context, preliminary data from the Federal Highway Administration show that vehicle miles traveled in the first half of 2021 increased by about 173.1 billion miles, or about 13%. The fatality rate for the first half of 2021 increased to 1.34 fatalities per 100 million VMT, up from the projected rate of 1.28 fatalities per 100 million VMT in the first half of 2020.
In addition to the traffic fatality data, NHTSA also released a report on Oct. 28 that evaluates key factors driving the spike in fatalities.
The report explores motorists’ behaviors from March 2020 through June 2021 and finds that incidents of speeding and lack of seat belt compliance remain higher than during pre-pandemic times.
For example, the report examines ejections from vehicles because they are a surrogate measure of seat belt use since people using seat belts are less likely to be ejected.
Based on EMS data when responding to a collision, the ejection rate in most of 2020 after week 10 — when the COVID-19 emergency was declared — shows an increase as compared to 2019. Moreover, the ejection rates through week 34 of 2021 were also higher in most weeks than those observed in 2019.
The report also examines speed data on various types of roads in both urban and rural settings. For example, it shows the range in speeds for urban interstates from the slowest 1% of vehicles (1st percentile) to the fastest 1% of vehicles (99th percentile) from January 2019 through June 2021.
It is interesting to note that the range of speeds from March 2020 through February 2021 became relatively narrow compared to previous months. Also noteworthy is the shift to consistently faster 99th percentile speeds from March through June 2021. In short, speeding has become a habitual practice of many drivers.
The rapid rise of traffic fatalities and drivers’ continued risky driving behaviors has prompted the U.S. Department of Transportation to produce the Department’s first ever National Roadway Safety Strategy to identify action steps for all stakeholders working to save lives on the roads.
The goal of the Safety Strategy is to significantly reduce serious injuries and deaths on our nation’s roadways. While the Department has an important leadership role to play in addressing this crisis, the agency notes that it will take concerted and coordinated effort across all levels of government, the private sector, and communities to reverse the current trend. The strategy will be released in January.
More Safety

Sponsored•August 1, 2026
Top 50 Executive Fleets
It is that time of year again! Time for the 2026 list of the Top 50 Executive Fleets, presented by Automotive Fleet and Volvo as part of its annual Fleet 500. Download now to see this year's list of companies!
Read More →
Sponsored•July 17, 2026
How Better Visibility Cut Speeding Violations by 48%
Fleet leaders don't need more data, they need clearer visibility into what the data is saying. This case study explores how one utility replaced speeding-event counts with a single metric — miles driven in violation — to strengthen safety and significantly reduce speeding violations.
Read More →
Operation Safe Driver Week: Why the Industry's Oldest Safety Campaign Still Matters to Fleets
A look at how a 2007 enforcement initiative became one of the most consequential weeks on the fleet safety calendar, and what it means for your drivers in 2026.
Read More →
Nexar-Nauto Merger Aims to Give Fleets Better Safety Intelligence Through Larger Driving Dataset
Stefan Heck tells Automotive Fleet that combining more than 10 billion miles of driving history with Nexar's AI models will give fleets deeper insights into driver risk and roadway conditions than either company could provide independently.
Read More →
Sponsored•July 2, 2026
From Silos to Solutions: Relationship Management for Safer Fleets
From telematics adoption and driver accountability to policy consistency and risk mitigation, this episode breaks down what it really takes to build a safer fleet culture without slowing business down.
Read More →
IIHS Launches First Commercial Vehicle Safety Evaluations
The Insurance Institute for Highway Safety has begun evaluating heavy-duty pickups and cargo vans for driver protection. Which models earned top marks?
Read More →
Reducing Risk by Eliminating Phone Use Behind the Wheel
Hosted with the cofounder of Lifesaver Mobile, this episode addresses phone use behind the wheel and how to design a driving environment that actually helps prevents accidents.
Read More →
Cameras, Safety and Insurance: From Reactive Claims to Real-Time Prevention (Part 2 of 2)
Part Two: Commercial auto remains one of the most challenging and costly lines of coverage for fleet operators and insurers alike. Continue learning more about how to effectively address these issues from Onur Aksan, Enterprise Business Development Executive, Geotab
Read More →
How 5-Second Telematics Data Is Changing Fleet Safety
This episode connects with Steve Santostasi of Ford Pro and covers how a few seconds of data can make a difference in fleet safety.
Read More →
The Two Biggest Summer Downtime Threats for Fleets
A conversation with a maintenance expert reveals the two most common summer maintenance pains and how to prevent them.
Read More →