




Report Lists Safest and Deadliest Counties for Driving
A report from the Auto Insurance Center lists the safest and most deadly counties for driving, based on federal road fatality data from the past 20 years.

A view of Virginia State Route 237 (Fairfax Drive) at Taylor Street in Arlington County, Va. Photo by Famartin/Wikimedia Commons.

A view of Virginia State Route 237 (Fairfax Drive) at Taylor Street in Arlington County, Va. Photo by Famartin/Wikimedia Commons.
Arlington County, Va., is the safest county in the U.S. for driving, and La Paz County, Ariz., is the deadliest, according to an Auto Insurance Center analysis of federal crash data from the past two decades.
The other nine counties cracking the top 10 list of safest counties are, in order, Bethel Census Area, Alaska; Broomfield County, Colo.; Bronx County, N.Y.; New York County, N.Y.; Kings County, N.Y.; Middlesex County, Mass.; Suffolk County, Mass.; Bristol County, R.I.; and Hennepin County, Minn.
At the other end of the spectrum, the nine counties joining La Paz County on Auto Insurance Center’s list of most dangerous counties are, in order, Tunica County, Miss.; Lowndes County, Ala.; Leon County, Texas; Big Horn County, Mont; Reeves County, Texas; Millard County, Utah; Emery County, Utah; Conecuh County, Ala.; and Jasper County, S.C.
The rankings are dependent on the number of fatal crashes per 10,000 residents.
“To pinpoint which states and counties are the safest and most dangerous for drivers, we analyzed more than 777,000 fatal accident records in the last 20 years from the National Highway Traffic Safety Administration’s Fatality Analysis Reporting System (FARS),” the Auto Insurance Center said in the online report.
Using the same criteria for states, the center determined that the five safest states are, in order: Massachusetts, District of Columbia (we know, technically not a state), New York, Rhode Island and New Jersey. The most dangerous states are, in order: Mississippi, Wyoming, Montana, Alabama and South Carolina.
What makes some states so much safer than others, based on the given criteria?
“Good public transportation is one feature that may play a role,” the Auto Insurance Center said. “Another factor may be the default speed limit on major highways in each state. The Northeast typically enforces top speeds of 55 or 65 miles per hour on urban and rural interstates respectively, while states in the South and West generally enforce top speeds of 70 to 75 miles per hour.”
Additionally, rural states such as Wyoming have many long stretches of two-lane roads that are seldom patrolled by law enforcement, the center pointed out. Many drivers exceed the speed limit as a result.
For additional data analysis by the Auto Insurance Center, click here.
More Safety

From Driver Well-Being to EV Charging | AF News Recap
Mental health belongs in the fleet safety conversation. This week, we’re looking at five ways fleets can support employee well-being before a crisis, plus Holman’s expansion in Mexico, new one-day Fleet Forward passes, and why EV charging demand is outpacing infrastructure growth.
Read More →
Nexar-Nauto Merger Aims to Give Fleets Better Safety Intelligence Through Larger Driving Dataset
Stefan Heck tells Automotive Fleet that combining more than 10 billion miles of driving history with Nexar's AI models will give fleets deeper insights into driver risk and roadway conditions than either company could provide independently.
Read More →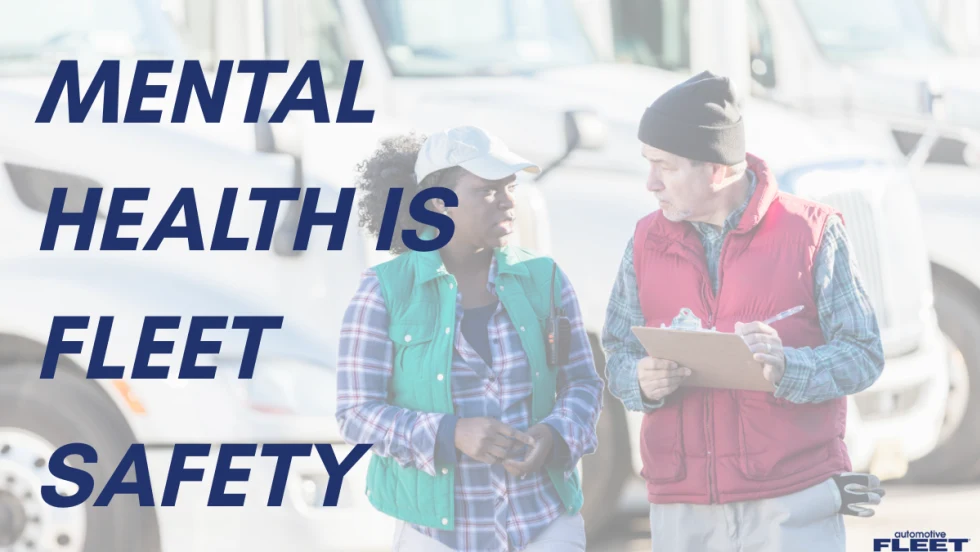
Don't Wait for a Crisis: 5 Ways to Build Mental Health Into Your Fleet Safety Program
For Suicide Prevention Month, fleet and safety leaders have an opportunity to put mental health where it belongs: at the center of workplace safety.
Read More →
How Camera Data Can Strengthen a Fleet’s Insurance Renewal
Insights from a commercial insurance carrier and a broker show how fleets can turn video telematic data, driver coaching, and improved claims results into a stronger case at insurance renewal.
Read More →
The Safest Fleets Aren’t the Ones with the Most Technology
You’ve made the telematics investment. Here’s how to capture the other half of its value and build the safest fleet on the road.
Read More →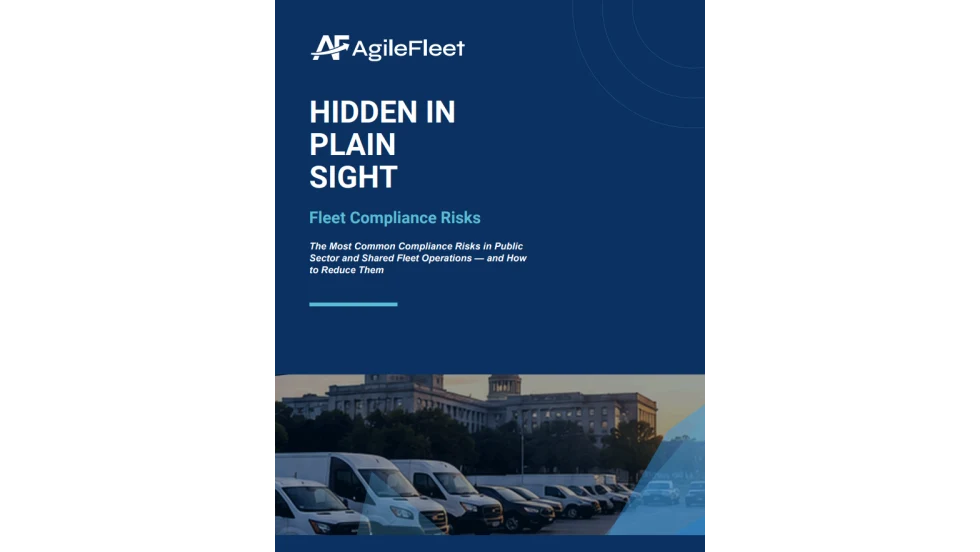
Hidden in Plain Sight: Fleet Compliance Risks
Fleet compliance isn't just about having policies — it's about consistently enforcing them. This practical guide reveals six hidden compliance risks common in public sector and shared fleet operations and outlines proven strategies to improve visibility, accountability, and audit readiness
Read More →
NETS Sets 2026 Fleet Safety Benchmark Conference for Indianapolis
The Sept. 15–17 program will feature fleet benchmarking data, case studies, emerging technologies, and implementation strategies while running alongside the NSC Safety Congress & Expo.
Read More →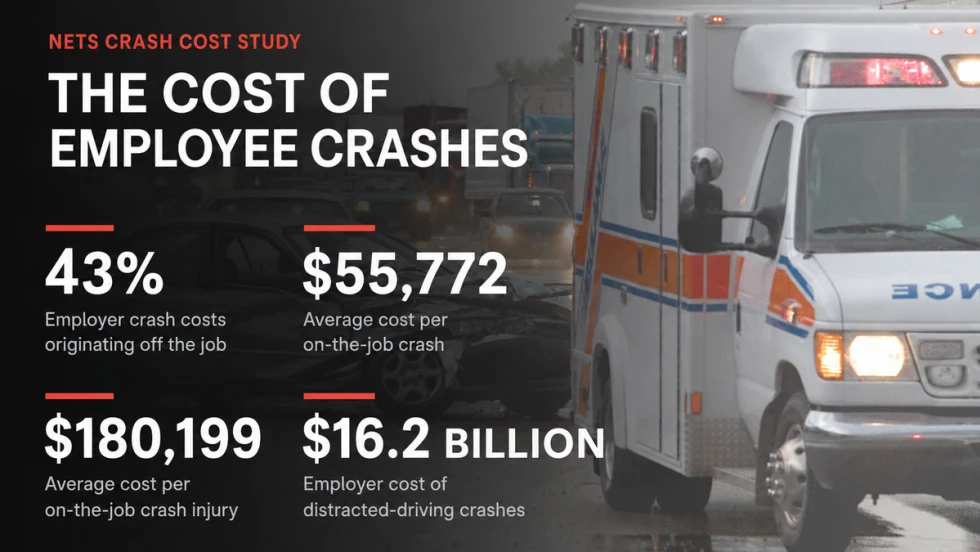
Off-the-Job Crashes Account for 43% of Employers’ $61.7 Billion Crash Burden
NETS quantifies costs dispersed across fleet, risk, HR, and other departments while providing new per-crash benchmarks for employers.
Read More →
Ram Recalls More Than 1.27 Million 1500 Pickups for Seat Belt Anchor Issue
The recall affects certain 2019-2026 Ram 1500 pickups that may have improperly attached second-row seat belt buckle anchors.
Read More →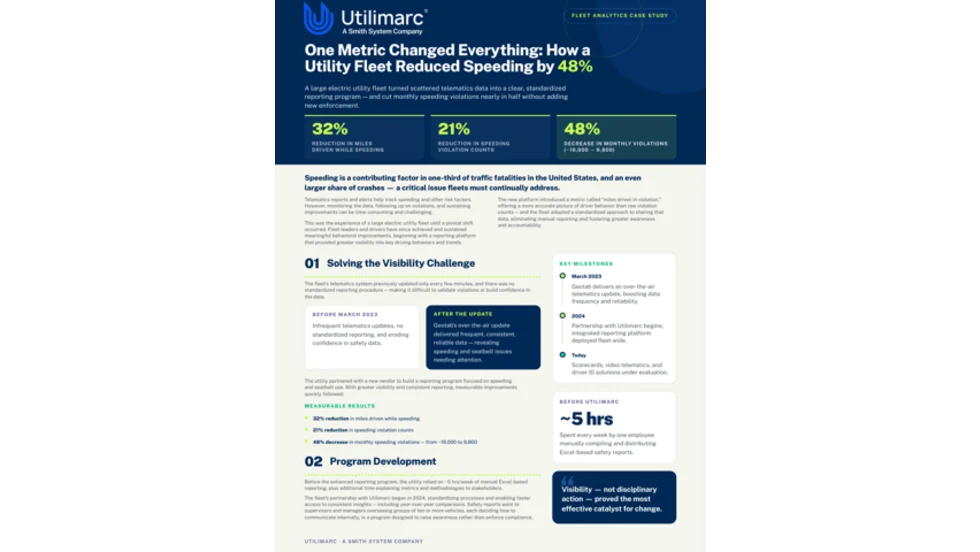
How Better Visibility Cut Speeding Violations by 48%
Fleet leaders don't need more data, they need clearer visibility into what the data is saying. This case study explores how one utility replaced speeding-event counts with a single metric — miles driven in violation — to strengthen safety and significantly reduce speeding violations.
Read More →