

Study Compares State Crash Fatality Rates
Montana, Mississippi and North Dakota have the highest fatality rates from road crashes per 100,000 people, researchers found.
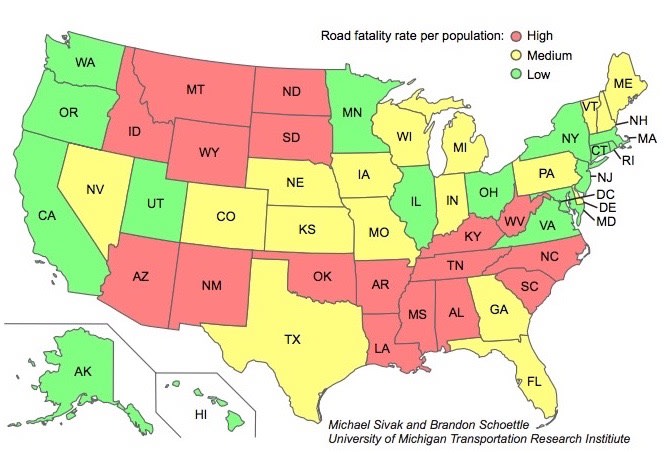
Fatality rate from road crashes per population, 2013. Source: UMTRI.

Fatality rate from road crashes per population, 2013. Source: UMTRI.
A new study concludes that U.S. crash fatalities in 2013 represented 1.3 percent of fatalities from all causes, with Montana having the highest road death rate (2.4 percent) and the District of Columbia having the lowest (0.4 percent).
The study, released by the University of Michigan Transportation Research Institute, compares road deaths to other causes of death in each state. Researchers relied on 2013 data from the Centers for Disease Control and Prevention (CDC) and the National Highway Traffic Safety Administration (NHTSA).
The U.S. saw 10.4 road crash fatalities per 100,000 people, as compared with 193.3 from heart diseases, 185 from cancer, 47.2 from lung diseases, 40.8 from strokes, and 26.8 from Alzheimer’s disease, according to the report. The highest rate of fatal road crashes per 100,000 people was 22.6 in Montana – 7.3 times the lowest rate of 3.1 in the District of Columbia. The five states with the highest rates were Montana, Mississippi, North Dakota, West Virginia and Alabama. The five with the lowest rates were the District of Columbia, Massachusetts, New Jersey, New York and Rhode Island.
Collision fatalities as a percentage of deaths from other causes varied greatly among the states, the study concluded. “For example, fatalities from road crashes as a percentage of fatalities from Alzheimer’s disease ranged from 91.4% in New Mexico to 13.3% in Washington,” researchers noted in the project’s summarizing abstract.
Fatalities from road collisions corresponded to 5.4 percent of fatalities from heart diseases, 5.6 percent of fatalities from cancer, 21.9 percent of fatalities from lung diseases, 25.4 percent of fatalities from strokes, and 38.6 percent of fatalities from Alzheimer’s disease, the study found.
The study’s authors are Michael Sivak and Brandon Schoettle.
More Safety

How Better Visibility Cut Speeding Violations by 48%
Fleet leaders don't need more data, they need clearer visibility into what the data is saying. This case study explores how one utility replaced speeding-event counts with a single metric — miles driven in violation — to strengthen safety and significantly reduce speeding violations.
Read More →
Operation Safe Driver Week: Why the Industry's Oldest Safety Campaign Still Matters to Fleets
A look at how a 2007 enforcement initiative became one of the most consequential weeks on the fleet safety calendar, and what it means for your drivers in 2026.
Read More →
Nexar-Nauto Merger Aims to Give Fleets Better Safety Intelligence Through Larger Driving Dataset
Stefan Heck tells Automotive Fleet that combining more than 10 billion miles of driving history with Nexar's AI models will give fleets deeper insights into driver risk and roadway conditions than either company could provide independently.
Read More →

From Silos to Solutions: Relationship Management for Safer Fleets
From telematics adoption and driver accountability to policy consistency and risk mitigation, this episode breaks down what it really takes to build a safer fleet culture without slowing business down.
Read More →
IIHS Launches First Commercial Vehicle Safety Evaluations
The Insurance Institute for Highway Safety has begun evaluating heavy-duty pickups and cargo vans for driver protection. Which models earned top marks?
Read More →
Reducing Risk by Eliminating Phone Use Behind the Wheel
Hosted with the cofounder of Lifesaver Mobile, this episode addresses phone use behind the wheel and how to design a driving environment that actually helps prevents accidents.
Read More →
Cameras, Safety and Insurance: From Reactive Claims to Real-Time Prevention (Part 2 of 2)
Part Two: Commercial auto remains one of the most challenging and costly lines of coverage for fleet operators and insurers alike. Continue learning more about how to effectively address these issues from Onur Aksan, Enterprise Business Development Executive, Geotab
Read More →
How 5-Second Telematics Data Is Changing Fleet Safety
This episode connects with Steve Santostasi of Ford Pro and covers how a few seconds of data can make a difference in fleet safety.
Read More →
Managing Road Risk at Scale: Why Fleet Safety Needs a Data-Driven Framework
Insights from the FIA Road and Driver Safety Indexes reveal how to manage road risk on a larger scale.
Read More →
Stellantis Recalls 1.3 Million Jeep Vehicles Worldwide Over Fire Risk
Stellantis is recalling more than 1.3 million Jeep Wrangler and Gladiator models worldwide over a fire risk linked to power steering pump wiring.
Read More →