




New Mexico Ranked as Worst State for Distracted Driving
Zutobi, an online driver education resource, looked at the latest numbers to identify which states had the greatest distracted driving issues. New Mexico reported the highest number of distracted driving deaths -- 12.52 deaths for every 100,000 drivers.


Here are the major causes of distracted driving accidents, according to stats from NHTSA.
Graphic: Zutobi
Zutobi, an online driver education resource, ranked each state from best to worst when it comes to distracted driving. The company looked at the latest numbers to identify the major causes of distracted driving, what the trends look like through recent years, and which states have the greatest distracted driving issues and the highest number of fatal road accidents.
Five percent of all drivers involved in fatal traffic crashes in 2022 were reported as distracted at the time of the crashes, according to a report by the National Highway Traffic Safety Administration (NHTSA).
Distracted driving occurs when the operator of the vehicle is trying to do something else besides driving. Since the driver’s attention is divided, distracted driving will boost the chance of a car accident or fatal crash. The most common driver distractions include other passengers in the vehicle, using a cell phone, adjusting audio or climate controls, eating or drinking, smoking, and daydreaming.
Sending or reading a text takes your eyes off the road for 5 seconds. At 55 mph, that’s like driving the length of an entire football field with your eyes closed.
Distracted driving continues to be a big reason for traffic accidents in the U.S., making up 8 percent of total fatal crashes. During 2022, 3,308 people were killed in crashes involving a distracted driver, which represented a 6 percent decrease from 3,522 deaths in 2021, according to NHTSA. During the last five years, roughly 15,961 people have been killed because of distracted driving.
Men are nearly three times as likely to be involved in a fatal distracted driving accident compared to women. Male drivers were distracted in 2,201 fatal crashes in 2022, whereas women drivers were distracted in 844 fatal crashes during the same period. In addition, about 20 percent of distracted drivers were between the ages of 15 and 24.
Distracted Driving Stats by States
For the third year in a row, New Mexico has the highest distracted driving crude rate in the country. According to statistics by NHTSA, New Mexico reported 169 distracted driving crashes in 2022. The state reported 12.52 distracted driving deaths for every 100,000 drivers, and 40 percent of all fatal crashes in the state were due to distracted driving.
The second-highest distracted driving rate goes to Kansas, followed by New Jersey, Louisiana, Kentucky, Hawaii, Idaho, Texas, Washington, and Wyoming.
State | Total deaths in fatal crashes due to distracted driving | Distracteddriving deaths per 100,000 licensed drivers | Percentage of fatal crashes involving distracted driving | Distracted driving crude rate |
New Mexico | 185 | 12.52 | 39.86% | 100.0 |
Kansas | 110 | 5.26 | 24.18% | 51.35 |
New Jersey | 183 | 2.83 | 26.48% | 44.53 |
Louisiana | 157 | 4.57 | 16.90% | 39.44 |
Kentucky | 128 | 4.29 | 17.46% | 39.06 |
Hawaii | 25 | 2.72 | 20.72% | 36.88 |
Idaho | 35 | 2.61 | 15.46% | 29.80 |
Texas | 495 | 2.71 | 11.09% | 24.72 |
Washington | 97 | 1.65 | 13.46% | 23.48 |
Wyoming | 12 | 2.79 | 8.47% | 21.76 |
The states with the lowest distracted driving crude rate included: Connecticut, Mississippi, Alaska, Nevada, North Carolina, California, Minnesota, South Carolina, Iowa, and New Hampshire. Rhode Island had the lowest rate at 0% and zero deaths in fatal crashes due to distracted driving.
State | Total deaths in fatal crashes due to distracted driving | Distracted driving deaths per 100,000 licensed drivers | Percentage of fatal crashes involving distracted driving | Distracted driving crude rate |
New Hampshire | 6 | 0.51 | 4.38% | 7.53 |
Iowa | 13 | 0.55 | 4.23% | 7.53 |
South Carolina | 33 | 0.83 | 3.14% | 7.24 |
Minnesota | 18 | 0.43 | 4.31% | 7.14 |
California | 148 | 0.55 | 3.38% | 6.42 |
North Carolina | 49 | 0.63 | 3.07% | 6.37 |
Nevada | 11 | 0.51 | 2.87% | 5.65 |
Alaska | 2 | 0.39 | 2.67% | 4.88 |
Mississippi | 12 | 0.59 | 1.86% | 4.69 |
Connecticut | 8 | 0.31 | 2.46% | 4.31 |
The large difference in distracted driving crashes could, in part, be attributed to different state guidelines on reporting distracted driving accidents. Additionally, it could be a result of work by local governments on tackling distracted driving through anti-text laws, awareness campaigns, and more.
More Safety

Does Your Fleet's Culture Encourage Distracted Driving?
What happens when the people responsible for enforcing safety rules are the ones setting the wrong example? The answer may reveal why some of the biggest risks to fleet drivers have little to do with what's written in the employee handbook.
Read More →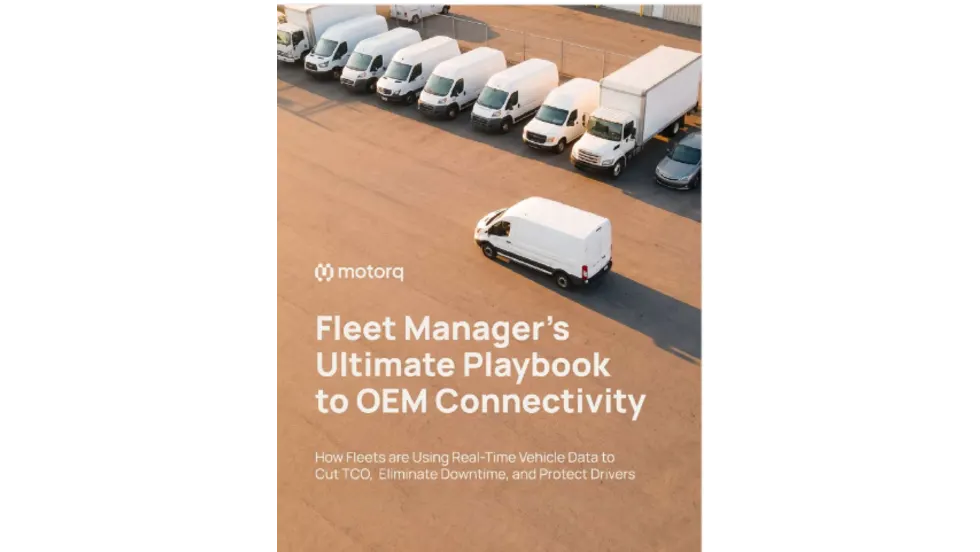
Fleet Manager’s Ultimate Playbook: Navigating the New Standard in OEM Connectivity
Rising operating costs, driver safety concerns, and unplanned downtime are putting unprecedented pressure on modern fleets. Discover how fleet managers use embedded OEM connectivity and real-time vehicle data to cut TCO, prevent downtime, and protect drivers without aftermarket telematics hardware.
Read More →
From Driver Well-Being to EV Charging | AF News Recap
Mental health belongs in the fleet safety conversation. This week, we’re looking at five ways fleets can support employee well-being before a crisis, plus Holman’s expansion in Mexico, new one-day Fleet Forward passes, and why EV charging demand is outpacing infrastructure growth.
Read More →
Nexar-Nauto Merger Aims to Give Fleets Better Safety Intelligence Through Larger Driving Dataset
Stefan Heck tells Automotive Fleet that combining more than 10 billion miles of driving history with Nexar's AI models will give fleets deeper insights into driver risk and roadway conditions than either company could provide independently.
Read More →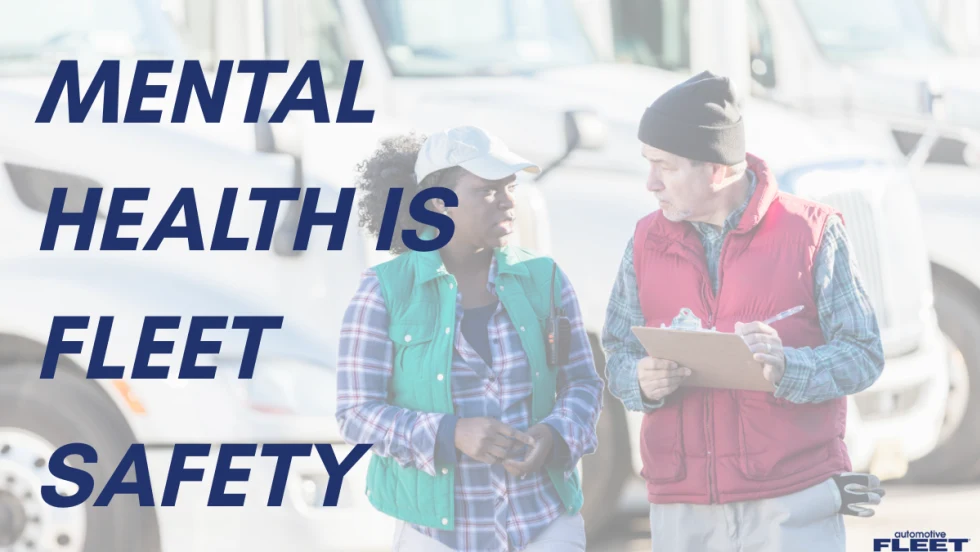
Don't Wait for a Crisis: 5 Ways to Build Mental Health Into Your Fleet Safety Program
For Suicide Prevention Month, fleet and safety leaders have an opportunity to put mental health where it belongs: at the center of workplace safety.
Read More →
How Camera Data Can Strengthen a Fleet’s Insurance Renewal
Insights from a commercial insurance carrier and a broker show how fleets can turn video telematic data, driver coaching, and improved claims results into a stronger case at insurance renewal.
Read More →
The Safest Fleets Aren’t the Ones with the Most Technology
You’ve made the telematics investment. Here’s how to capture the other half of its value and build the safest fleet on the road.
Read More →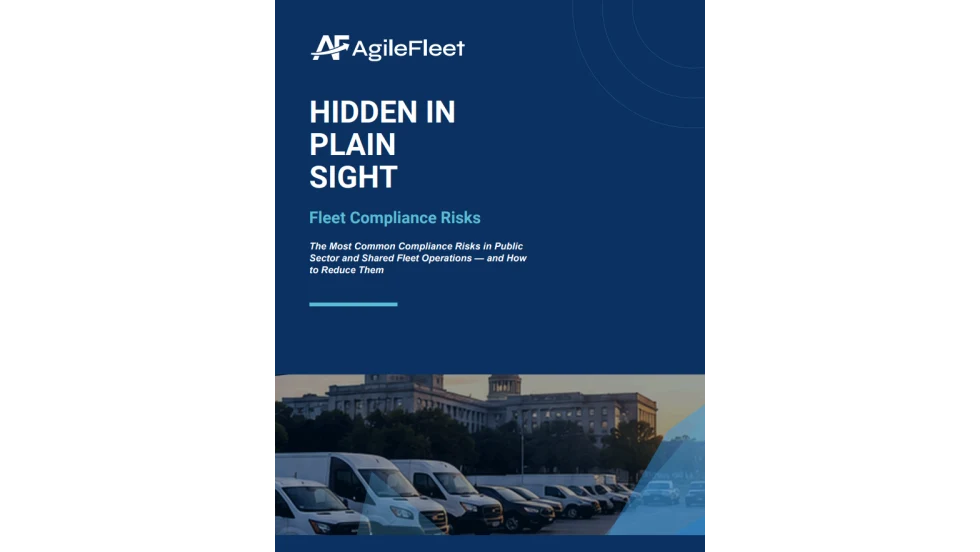
Hidden in Plain Sight: Fleet Compliance Risks
Fleet compliance isn't just about having policies — it's about consistently enforcing them. This practical guide reveals six hidden compliance risks common in public sector and shared fleet operations and outlines proven strategies to improve visibility, accountability, and audit readiness
Read More →
NETS Sets 2026 Fleet Safety Benchmark Conference for Indianapolis
The Sept. 15–17 program will feature fleet benchmarking data, case studies, emerging technologies, and implementation strategies while running alongside the NSC Safety Congress & Expo.
Read More →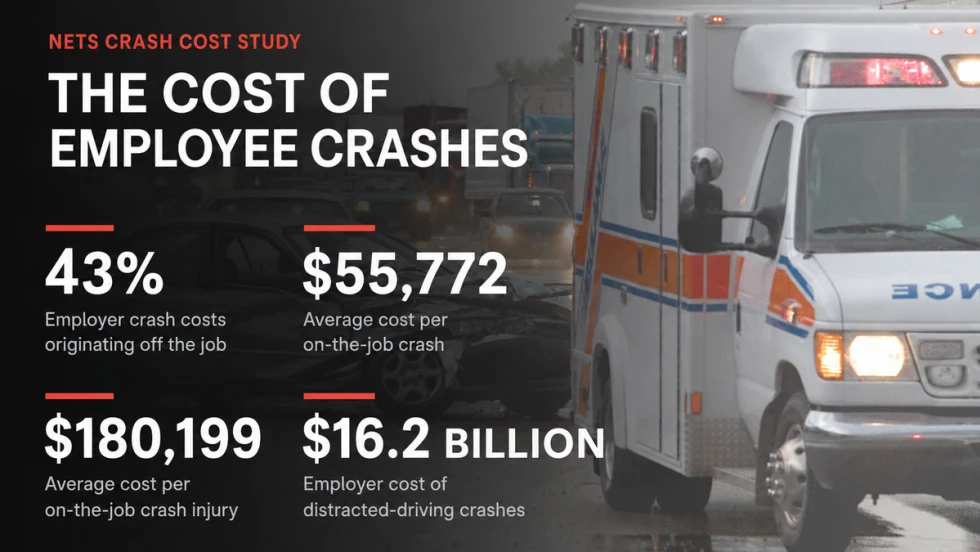
Off-the-Job Crashes Account for 43% of Employers’ $61.7 Billion Crash Burden
NETS quantifies costs dispersed across fleet, risk, HR, and other departments while providing new per-crash benchmarks for employers.
Read More →