





More Analysis: A Tight & Declining Wholesale Market
Manheim Index Declines Again as Used Vehicle Market Slows
Only three of eight major market segments saw seasonally adjusted prices that were higher year over year in September. The full-year Manheim Used Vehicle Value Index forecast is expected to finish the year down nearly 14% YOY, up from the second quarter’s revised forecast of a 6% decline.
October 7, 2022
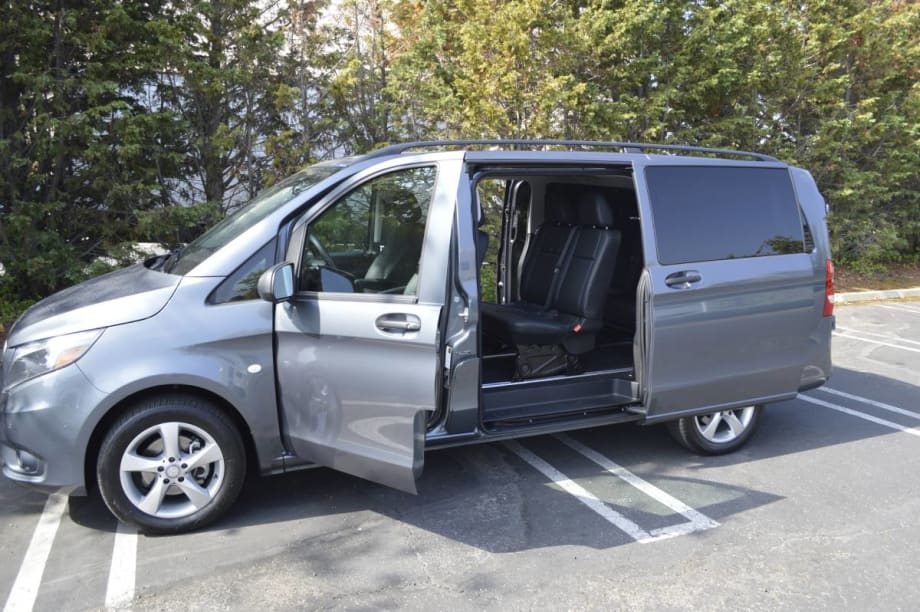
The used market has seen much more normal supply conditions this year. In fact, the used market has been oversupplied for most of the year.
Photo: Bobit
5 min to read
Wholesale used-vehicle prices (on a mix, mileage, and seasonally adjusted basis) decreased 3% in September from August, bringing the Manheim Used Vehicle Value Index to 204.5, down 0.1% from a year ago, Cox Automotive reported Oct. 7.
The non-adjusted price change declined 2.1% in September, bringing it to a decrease of 2.3% year over year. September 2022 was the first month since May 2020 that wholesale values declined year over year.
“2022 has been the year of giving back some of the big 2021 increases when it comes to wholesale used-vehicle values,” said Cox Automotive chief economist Jonathan Smoke in a news release. “Vehicles are once again depreciating assets. As we look at the cumulative declines this year, we are down significantly and now expect to finish the year down nearly 14% in December. We haven’t seen declines like this since the onset of the pandemic and the beginning of the Great Recession.”
In September, Manheim Market Report (MMR) values saw larger-than-normal declines that were consistent over the month, culminating in a 2.5% total decline in the Three-Year-Old Index over the last four weeks. MMR is a valuation tool used by tens of thousands of vehicle consignors and dealers to assess millions of trade-ins each month. It is designed to be highly stable and avoid overreacting to short-term market ups and downs to provide an accurate measure of vehicle valuations regardless of market conditions.
During September, daily MMR Retention, which is the average difference in price relative to current MMR, averaged 98.4%, meaning market prices were below MMR values. The average daily sales conversion rate decreased slightly to 49.2%, below normal for the time of year. For example, the sales conversion rate averaged 52.1% in September 2019. The lower conversion rate indicated that the month saw buyers with more bargaining power than what is typically seen for the time of year.
Only three of eight major market segments saw seasonally adjusted prices that were higher year over year in September. Compact cars had the largest increase, at 5.9%, followed by vans and pickups, both of which increased by 0.8%. The remaining five segments’ prices were well below the industry average, with midsize cars only priced minimally lower. Compared to August, all eight major segments’ performances were down. Full-size cars lost more than 14%. Pickups and compact cars declined the least, at 1.4% and 2.6%, respectively. The remaining five segments (vans, SUVs, midsize, luxury, and sports cars) lost between 3.1% and 5.2%.
“Given that we are back to depreciation, it is more likely that the next few months will also see negative figures; however, we are not anticipating any major declines,” said Chris Frey, senior manager of economic and industry insights of Cox Automotive. “Our expectation is that depreciation over the next three months will be slower and lower than what we’ve just seen this past quarter.”
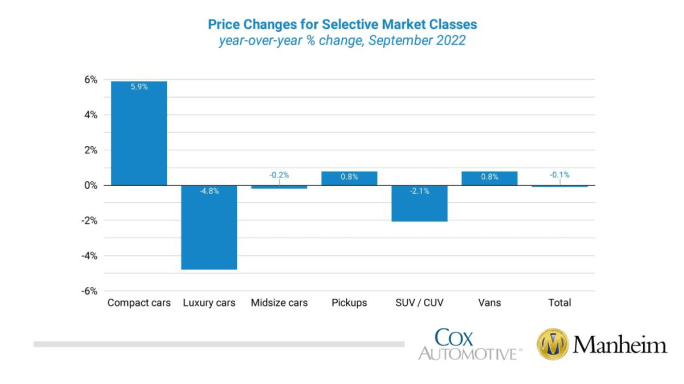
Compact cars had the largest increase, at 5.9%, followed by vans and pickups, both of which increased by 0.8%. The remaining five segments’ prices were well below the industry, with midsize cars only minimally lower. Compared to August, all eight major segments’ performances were down.
Graphic: Cox Automotive
Retail Used Sales Pace Decreases in September, Used Supply Remains Healthy
Leveraging a same-store set of dealerships selected to represent the country from Dealertrack, Cox estimates that used retail sales declined 8% in September from August and that used retail sales were down 10% year over year. Compared to September 2019, sales were down 18%, a slight improvement from August, when sales were down 19%, based on the same-store results.
The used market has seen much more normal supply conditions this year. In fact, the used market has been oversupplied for most of the year. Dealers built inventory in January and February; but because of sales failing to live up to normal levels in the spring and summer, supply compared to normal, or for example 2019, has been elevated until September.
Using estimates of used retail days’ supply based on vAuto data, September ended at 48 days of supply, down from 51 days at the end of August but higher than how September 2021 ended at 41 days. Leveraging Manheim sales and inventory data, wholesale supply is estimated to have ended September at 27 days, higher than how September 2021 ended at 19 days but down one day from the end of August.
September’s total new-light-vehicle sales were up 9.5% year over year, with the same number of selling days as September 2021. By volume, September new-vehicle sales were down 1% from August. The September SAAR came in at 13.5 million, a 9.6% increase from last year’s 12.3 million and up 2.9% from August’s 13.1 million pace.
Combined sales into large rental, commercial, and government fleets were up nearly 25% year over year in September. Sales into rental were up 18% year over year, while sales into commercial fleets were up 38% and sales into government fleets were down 2%. Including an estimate for fleet deliveries into dealer and manufacturer channels, the remaining retail sales were estimated to be up 8.2%, leading to an estimated retail SAAR of 11.8 million, up 0.3 million from last month’s pace, or 2.6%, and up 0.9 million from last year’s 10.9 million, or 8.5%. The fleet share of 12.3% was down 0.2% from August but up 1.1% from last September’s 11.2%.
Rental Risk Mileage Declines, Maintains Stability
The average price for rental risk units sold at auction in September was up 0.6% year over year. Rental risk prices were down 2.9% compared to August. Average mileage for rental risk units in September (at 54,200 miles) was down 4.3% compared to a year ago and down 4.1% from August.
Manheim Used Vehicle Value Index Full-Year Forecast Lowered
The full-year Manheim Used Vehicle Value Index forecast is now expected to finish the year down nearly 14% year over year. This change from the second quarter’s revised forecast of a 6% decline was made in recognition of the third quarter’s seeing the largest declines of 2022 and further decreases being forecast for November and December.
Measures of Consumer Confidence Mixed in September
The Conference Board Consumer Confidence Index increased 4.2% in September. Both underlying measures of present situation and expectations saw gains, but expectations improved the most. Plans to purchase a vehicle in the next six months increased and were up year over year.
The sentiment index from the University of Michigan also saw a slight gain in September. The Michigan index rose 0.7%, with only views of current conditions improving. Both the Conference Board and Michigan data sets do not include survey data representing the entire month, and sentiment weakened in the final days of the month.
Morning Consult’s timelier daily Index of Consumer Sentiment declined in September with moves down in most of the last 14 days of the month. That index ended down 0.7% for the month, though it had been improving earlier in the month. Stock market declines and gas price increases likely influenced the more recent decline.
Topics:Used Vehicle SalesWholesale ValuesUsed Vehicle ValuesFleet SalesManheim IndexRemarketingOperations
Originally posted on Vehicle Remarketing
More Remarketing
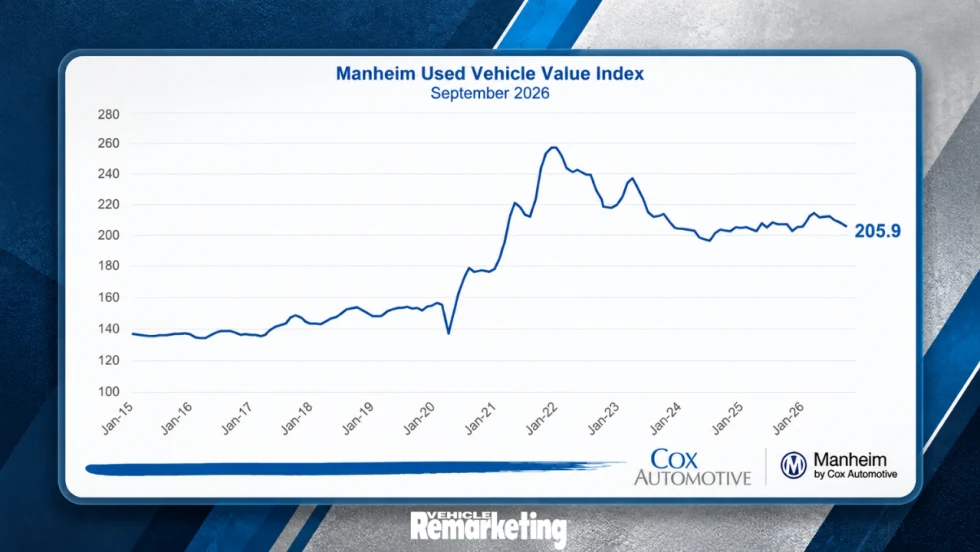
Wholesale Used-Vehicle Values Fall as Cox Automotive Cuts 2026 Forecast
Wholesale used-vehicle prices declined in September as depreciation accelerated, prompting Cox Automotive to lower its year-end forecast.
Read More →
FLD Promotes Three Executives in Leadership Changes
FLD has promoted three longtime executives, naming Gary Mott CEO, Richard Mallek president, and Ron Sanders managing partner.
Read More →
Ford Pro Launches Certified Pre-Owned Program for Commercial Vehicles
Ford Pro Advantage will offer certified pre-owned Class 1-7 commercial vehicles through more than 700 Ford Pro Commercial Vehicle Centers.
Read More →
Copart to Acquire ACV in $1.9 Billion Deal
The acquisition would expand Copart beyond its traditional salvage business into dealer-to-dealer wholesale remarketing while adding ACV’s vehicle data, inspection, and valuation technology.
Read More →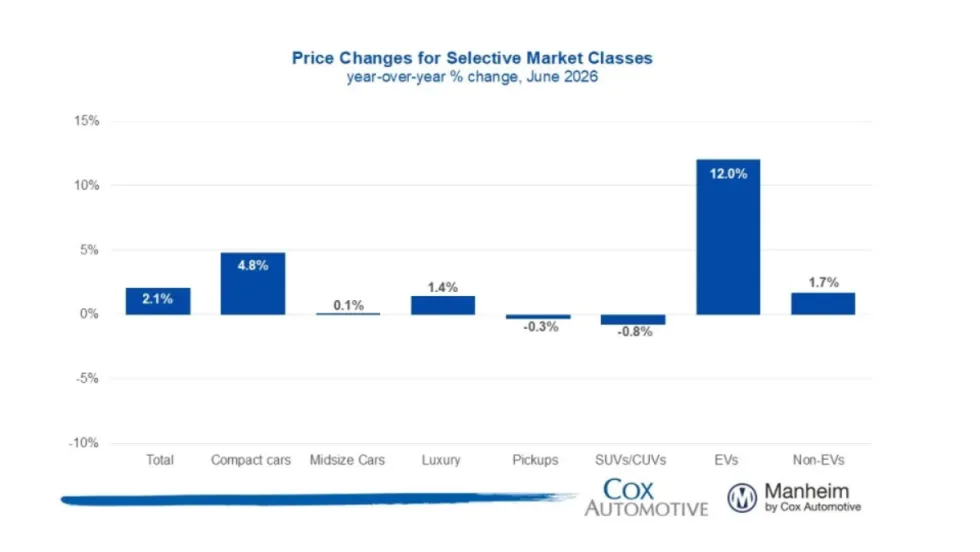
Manheim Index Shows Used-Vehicle Wholesale Prices Up 2.1% in June
The market is seeing stronger appreciation in older used vehicles this year, and the most affordable segments have been among the year’s best performers.
Read More →
Commercial Fleet Sales Contribute To June, YTD Gains
The fleet sector has boosted its vehicle purchases at a reliable pace in the first half of this year compared with 1H 2025.
Read More →
Used Vehicle Prices Climb Higher As Sales Pace Slows
The higher prices at used retail reflect strong wholesale values earlier in the spring, particularly for older, more affordable vehicles.
Read More →
Wholesale Used Vehicle Market Sustains Moderate Rise In Values, Prices
Trends continue to normalize after a strong start to the year, as consumers contend with higher gas prices in the coming summer months.
Read More →
Commercial Fleet Sales Still Lead Sectors Despite May Mini Dip
The U.S. economy's continued growth and positive business investment are creating a favorable environment for fleet vehicle demand.
Read More →
How Connected Vehicle Data Is Lifting Fleet Resale Values
A vehicle health score could improve the value of fleet vehicles at remarketing. The path to a universal standard is forming, and fleets that understand the process early will be better positioned when it arrives.
Read More →