

Drug Tests Indicate More Workers Getting High
A new report from Quest Diagnostics reveals a spike in positive employee drug tests, and use of illicit drugs such as cocaine is driving the trend.

Photo via Wikimedia Commons.

Photo via Wikimedia Commons.
Positive drug test results among American workers have reached their highest rate in 12 years, according to a new report from Quest Diagnostics, and illicit drug use has fueled the spike.
Quest Diagnostics, which specializes in medical diagnostic information services, analyzed more than 10 million workforce drug test results for its annual Drug Testing Index. In 2016, overall positivity in urine drug testing among the combined U.S. workforce segments (both safety-sensitive and general) was 4.2% — a 5% relative increase over 2015’s rate of 4.0% and the highest annual positivity rate since 2004 (4.5%), the company said.
The positivity rate in urine testing for cocaine increased for the fourth straight year in the general U.S. workforce and for the second straight year in the federally mandated safety-sensitive workforce, according to the research. In the general workforce, positive results for cocaine jumped 12% in 2016, reaching a seven-year high of 0.28% compared to 0.25% in 2015. In the safety-sensitive workforce, the cocaine positivity rate rose 7% to reach 0.28% compared to 0.26% in 2015.
“This year’s findings are remarkable because they show increased rates of drug positivity for the most common illicit drugs across virtually all drug test specimen types and in all testing populations,” said Barry Sample, senior director of science and technology for Quest Diagnostics Employer Solutions. “Our analysis suggests that employers committed to creating a safe, drug-free work environment should be alert to the potential for drug use among their workforce.”
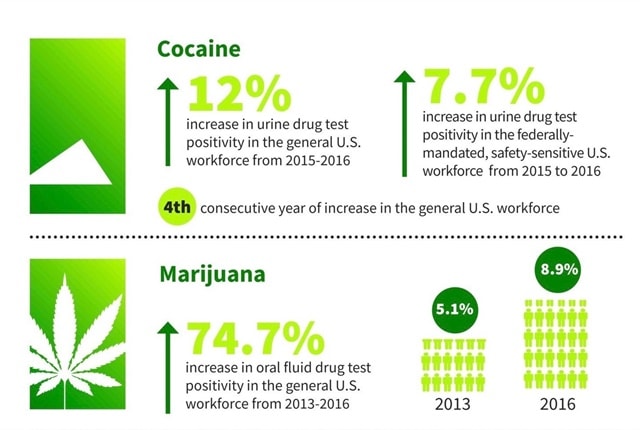
Inforgraphic courtesy of Quest Diagnostics.
Quest Diagnostics presented its annual Drug Testing Index analysis at the Drug and Alcohol Testing Industry Association annual conference last week in Orlando.
In both the safety-sensitive and the general workforces, the positivity rate for cocaine in post-accident urine drug tests was more than twice that of pre-employment drug tests, and was also higher than the rate in random drug tests.
“While a positive test doesn’t prove drug use caused the accident, it raises the question as to whether it played a role,” Sample said.
Positive test result rates for marijuana continued an upward climb in both the safety-sensitive and general workforces. In saliva testing, which detects recent drug use, marijuana positivity increased nearly 75%, from 5.1% in 2013 to 8.9% in 2016 in the general workforce. Marijuana positivity also increased in both urine testing (2.4% in 2015 versus 2.5% in 2016) and hair testing (7.0% in 2015 versus 7.3% in 2016) in the same population, according to Quest Diagnostics.
Within the safety-sensitive workforce, which is tested using urine samples only, marijuana positivity increased nearly 10% (0.71% in 2015 versus 0.78% in 2016), the largest year-over-year increase in five years.
In Colorado and Washington, the first states to make recreational marijuana use legal, the overall urine-test positivity rate for marijuana outpaced the national average in 2016 for the first time since the statutes took effect. The increase was more pronounced in Colorado, which climbed 11% (2.61% in 2015 versus 2.90% in 2016), than in Washington, which rose 9% (2.82% in 2015 versus 3.08% in 2016). In the general workforce, the national urine-test positivity rate for marijuana increased 4% (2.4% in 2015 compared to 2.5% in 2016).
“We have been tracking the trends in marijuana positivity in states that have passed medical and recreational marijuana use statutes for several years now,” Sample explained. “2016 is the first year since Colorado and Washington approved recreational use that the rates of year-over-year change were sharply higher than the national average.”
Urine-test positive test results for amphetamines, including methamphetamine, continued a year-over-year upward trend as well, increasing more than 8% in both the general and safety-sensitive workforces compared to 2015. Throughout the past decade, this rise has been driven primarily by amphetamine use, Quest Diagnostics noted. Included are widely used prescription drugs such as Adderall.
Although urine-test positive results for methamphetamine declined between 2005 and 2008, the positivity rate plateaued between 2008 and 2012 and has increased steadily since, according to the report. Between 2012 and 2016, positive results climbed 64% in the general workforce and 14% among safety-sensitive workers. With saliva tests, methamphetamine positive test results increased 75% between 2013 (0.24%) and 2016 (0.42%).
After four straight years of increases, 2016 urine-test positive results for heroin held steady in the general workforce and declined slightly among safety-sensitive workers.
Positive test results for prescription opiates — including hydrocodone, hydromorphone and oxycodones — declined in urine testing among the general U.S. workforce, Quest Diagnostics found. Oxycodones have exhibited four consecutive years of declines, dropping 28% — from 0.96% in 2012 to 0.69% in 2016. Hydrocodone and hydromorphone both showed double-digit declines in 2015 and 2016. Hydrocodone positive results dropped from 0.92% in 2015 to 0.81% in 2016. Hydromorphone positive results dipped from 0.67% in 2015 to 0.59% in 2016.
In recent years, state and federal authorities have instituted efforts to more tightly control opiate prescribing in order to address the opioid crisis.
For more detailed data from the Quest Diagnostics Drug Testing Index, click here.
More Safety

Top 50 Executive Fleets
It is that time of year again! Time for the 2026 list of the Top 50 Executive Fleets, presented by Automotive Fleet and Volvo as part of its annual Fleet 500. Download now to see this year's list of companies!
Read More →
How Better Visibility Cut Speeding Violations by 48%
Fleet leaders don't need more data, they need clearer visibility into what the data is saying. This case study explores how one utility replaced speeding-event counts with a single metric — miles driven in violation — to strengthen safety and significantly reduce speeding violations.
Read More →
Operation Safe Driver Week: Why the Industry's Oldest Safety Campaign Still Matters to Fleets
A look at how a 2007 enforcement initiative became one of the most consequential weeks on the fleet safety calendar, and what it means for your drivers in 2026.
Read More →
Nexar-Nauto Merger Aims to Give Fleets Better Safety Intelligence Through Larger Driving Dataset
Stefan Heck tells Automotive Fleet that combining more than 10 billion miles of driving history with Nexar's AI models will give fleets deeper insights into driver risk and roadway conditions than either company could provide independently.
Read More →
From Silos to Solutions: Relationship Management for Safer Fleets
From telematics adoption and driver accountability to policy consistency and risk mitigation, this episode breaks down what it really takes to build a safer fleet culture without slowing business down.
Read More →
IIHS Launches First Commercial Vehicle Safety Evaluations
The Insurance Institute for Highway Safety has begun evaluating heavy-duty pickups and cargo vans for driver protection. Which models earned top marks?
Read More →
Reducing Risk by Eliminating Phone Use Behind the Wheel
Hosted with the cofounder of Lifesaver Mobile, this episode addresses phone use behind the wheel and how to design a driving environment that actually helps prevents accidents.
Read More →
Cameras, Safety and Insurance: From Reactive Claims to Real-Time Prevention (Part 2 of 2)
Part Two: Commercial auto remains one of the most challenging and costly lines of coverage for fleet operators and insurers alike. Continue learning more about how to effectively address these issues from Onur Aksan, Enterprise Business Development Executive, Geotab
Read More →
How 5-Second Telematics Data Is Changing Fleet Safety
This episode connects with Steve Santostasi of Ford Pro and covers how a few seconds of data can make a difference in fleet safety.
Read More →
The Two Biggest Summer Downtime Threats for Fleets
A conversation with a maintenance expert reveals the two most common summer maintenance pains and how to prevent them.
Read More →