




NAFA Study Shows Increase in Fleet Operating Costs
Survey indicates that running costs have risen two cents per mile.
Fleet operating costs have risen by two cents per mile, according to the annual study of those expenses by the National Association of Fleet Administrators (NAFA). The association attributed the higher costs to major increases in fuel and maintenance expenses. The survey garnered 110 responses from fleets that operate more than 55,000 units.
The study measures those costs that are connected with the operation of fleet vehicles and includes such categories as fuel, oil, tires, repairs and maintenance. In addition, figures on incidental expenses such as license and taxes, accident damage repair, washes, tolls and parking and miscellaneous are also calculated. Also represented are standing or fixed costs such as interest, depreciation, insurance and credits due to personal use chargebacks.
NAFA's operating expense report is broken out into three categories of vehicles: small, mid-size and large. The small vehicles are those having a wheelbase less than 106 inches, and having a curb weight under 3,000 pounds. The mid-size models are classified by wheelbases between 106 and 114 inches and curb weights between 3,001 and 3,500 pounds. The large cars have wheelbases in excess of 114 inches and weigh more than 3,500 pounds at the curb. One other category included in the report is composite fleets for those answers that express total operating expenses for the fleet without breaking those numbers down by car size.
In the small car category, the NAFA study reported that these vehicles increased in average operating costs a little more than two cents per mile to 7.2 cents per mile. The 1978 survey reported operating costs for these vehicles at 5.1 cents per mile. Accounting for almost half the increase in operating costs was fuel, which increased a penny from 3.81 cents per mile to 4.81 cents per mile. Normal repairs and maintenance increased by almost a penny a mile from .83 to 1.81 cents per mile. The study also noted that among the fleets reporting engine size, 92 percent of the vehicles are equipped with six cylinder powerplants, while the remaining eight percent are powered by four cylinder engines.
The average monthly mileage for cars in this group is 1,718. Based on an average gasoline cost of 87 cents per gallon for the entire 1979 calendar year, the small cars averaged 18.1 miles per gallon. According to NAFA, the small car segment of the responses did not generate sufficient data to provide an analysis of standing and incidental expenses.
In the mid-size car category, total operating expenses for this class amounted to an average of 7.43 cents per mile. That total represents an increase of 1.5 cents over the 1978 total of 5.92 cents per mile.
Fuel costs alone accounted for more than a penny of that increase as these costs climbed to 5.51 cents per mile, compared to the 4.29 cents per mile average logged in 1978. While fuel costs were up, other items such as oil, tires and tire repairs, and repair and maintenance showed only minor increases over last year's study.
As with the small cars, engine size in the mid-size class was reported as being almost entirely composed of six cylinder engines, with that powerplant accounting for 94 percent of the total. Eight cylinder engines represent six percent, while less than one-half of one percent reported using four cylinder engines in mid-size cars.
Average monthly mileage for this category was reported at 1,765 miles. Using the 87 cents per gallon average figure, the cars in this group logged 15.8 miles per gallon. Incidental expenses such as license and taxes, accident repair, washing and so on amounted to an average of $26.54 per car per month in the mid-size group, while standing expenses totaled $192.36 per month. Personal use chargebacks netted the fleets $29.72 per month in return, resulting in a net incidental and standing expense of $189.19 per car per month. Using the average monthly mileage figure of 1,765 miles, NAFA calculates that the incidental and standing expenses, less the credit from personal use chargebacks, amount to 10.72 cents per mile. When the operating cost total for this class of 7.43 cents per mile is added to the incidental and standing expenses, the total per mile cost of vehicles in this category is 18.15 cents per mile. In dollars per month per car, NAFA reports the total expense for the mid-size car as $320.32.
Large cars posted the greatest increase in costs out of the three car categories. The three-cents-per-mile boost in costs was attributed mainly to fuel. According to the 1978 survey, large car operating costs were 6.23 cents per mile, while the 1979 survey shows a total of 9.10 cents per mile. Over two cents of that increase is due to fuel, which rose from 4.67 cents per mile in 1978 to 6.79 cents per mile in the latest survey. Repairs and maintenance increased just under a penny a mile and accounted for 1.64 cents of the total operating cost per mile.
Average monthly mileage for cars in this category was reported at 1,772. Based on the 87 cents per gallon figure, these cars averaged 12.8 miles per gallon during the year. As with the small car category, NAFA reported that data responses in this class were insufficient to provide an analysis of incidental and standing costs.
For those fleets reporting expenses without breaking their numbers down by car size, NAFA compiled the figures in a separate group called "Composite Fleet." This category posted an increase in operating costs of just over a penny per mile with the 1979 figure totaling 7.45 cents per mile as compared to 1978's 6.11 cents per mile. Almost the entire increase is attributed to fuel costs, which rose from 4.43 cents per mile.
While the composite group did not report expenses by car size, they did provide a breakdown of car size in their fleets as well as engine combinations. In this category, 64 percent of the vehicles are mid-size, 23 percent small size and 13 percent large cars. Of the small cars, 92 percent are equipped with six cylinder engines, while eight percent are equipped with fours. None of the mid-size models are equipped with four cylinder engines, although 78 percent have sixes and 22 percent are equipped with eights. In the large cars, 35 percent have six cylinder powerplants while the remaining 65 percent have eight cylinder engines.
Incidental expenses in this category, according to NAFA, amounted to $28.32 per car per month. Standing expenses were $175.88 per car per month. Credits to the fleet for personal use chargebacks totaled $21.86 per month. The total incidental and standing expenses, minus the personal use chargeback figure, amounted to $182.56 per month. Using a figure of 1,798 miles per month for the average use of these vehicles, incidental and standing expenses were figured at 10.15 cents per mile. Combined with the operating costs of 7.45 cents per mile, cars in the composite fleet cost 17.6 cents per mile. Total dollar cost for that figure is $319.51 per month.
Also included in the survey were some figures on Canadian fleets. According to NAFA, 10 fleets representing 3,534 passenger cars in Canada responded. Total operating expenses for this group were reported as 7.83 cents per mile, slightly higher than the U.S. composite fleet, but actually lower than the 1978 figure of 8.34 cents per mile. Fuel costs remained essentially the same, with the current figure reported as 5.7 cents per mile as compared to 1978's total of 5.67 cents per mile. Repair and maintenance costs for the Canadian fleets actually dropped one-half cent per mile during 1979. The cars in the Canadian group averaged 15.8 miles per gallon in U.S. measurements and were driven an average of 1,400 miles per month.
A Summary of NAFA's 1979 Operating Expense Report
Small Cars | Mid-Size Cars | Large Cars | Composite Fleet | |
average miles per month | 1,718 | 1,765 | 1,772 | 1,798 |
OPERATING EXPENSES (expressed in pennies per car mile) | ||||
fuel | .0481 | .0551 | .0679 | .0548 |
oil | .0011 | .0014 | .0014 | .0011 |
tires & tire repair | .0047 | .0060 | .0053 | .0057 |
repair & maintenance | .0181 | .0118 | .0164 | .0129 |
TOTAL OPERATING EXPENSES | .0720 | .0743 | .0910 | .0745 |
INCIDENTAL EXPENSES (Expressed in dollars per car month) | ||||
License & Taxes | n/a | $5.82 | n/a | $7.33 |
Accident Repairs - Less Recoveries | n/a | $7.75 | n/a | $7.25 |
Washing | n/a | $4.10 | n/a | $3.02 |
Parking & Tolls | n/a | $7.29 | n/a | $9.43 |
Miscellaneous | n/a | $1.58 | n/a | $1.29 |
Total Incidental Expenses | n/a | $26.54 | n/a | $28.32 |
STANDING EXPENSES (expressed in dollars per car per month) | ||||
Interest or Service Charge | n/a | $25.09 | n/a | $33.08 |
Depreciation Reserve | $147.85 | n/a | $128.25 | |
Depreciation Adjustment, if any | n/a | - .26 | n/a | -2.19 |
Selling Expenses | n/a | $3.00 | n/a | - |
Insurance | n/a | $16.68 | n/a | $16.74 |
Total Standing Expenses | n/a | $192.36 | n/a | $175.88 |
CREDITS (Dollar return per car per month) | ||||
Personal Use Chargeback | n/a | $29.72 | n/a | $21.86 |
NET EXPENSES (Incidental expenses plus standing expenses less personal use credit expressed in dollars per car per month) | $189.18 | $182.56 |
More Operations

Fleet Has a Talent Pipeline Problem. What Comes Next? | AF News Recap
Where will fleet’s next generation of leaders come from? This week, we’re looking at the industry’s talent pipeline, what certification can add to a fleet career, how to build an award-worthy track record, and the return of Automotive Fleet’s Personal Use Survey.
Read More →
Smith System Launches Driver Risk Management Program
Fleets have more driver data than ever, but identifying risky behavior doesn't necessarily correct it. Smith System's new Driver Risk Management program combines monitoring, training, and follow-up coaching to help fleets connect risk signals with driver intervention.
Read More →
Automotive Fleet Opens 2026 Personal Use Survey for Commercial Fleet Managers
Less than two weeks left! Commercial and corporate fleet managers are invited to share how their organizations handle company vehicle personal-use policies, charges, and driver eligibility.
Read More →
From AI Prompts to AI-Generated Safety Songs | AF News Recap
Can better prompts make AI more useful for fleet managers? This week, we’re breaking down smarter fleet analysis, an AI-assisted experiment that turned safety training into music, and what happened to fuel prices in August.
Read More →
How to Write Better AI Prompts for Fleet Analysis
Include these six elements in your fleet prompts to generate more relevant analysis and accurate answers.
Read More →
Fleet Meets: Eric Kilgore
This edition of the Fleet Meets series features one of the industry's best leaders driving multi-market and national operations.
Read More →
Why Reactive Fleet Management Is Becoming Too Expensive to Sustain
Research highlights a growing need for proactive management strategies to address rising costs in fleet operations effectively.
Read More →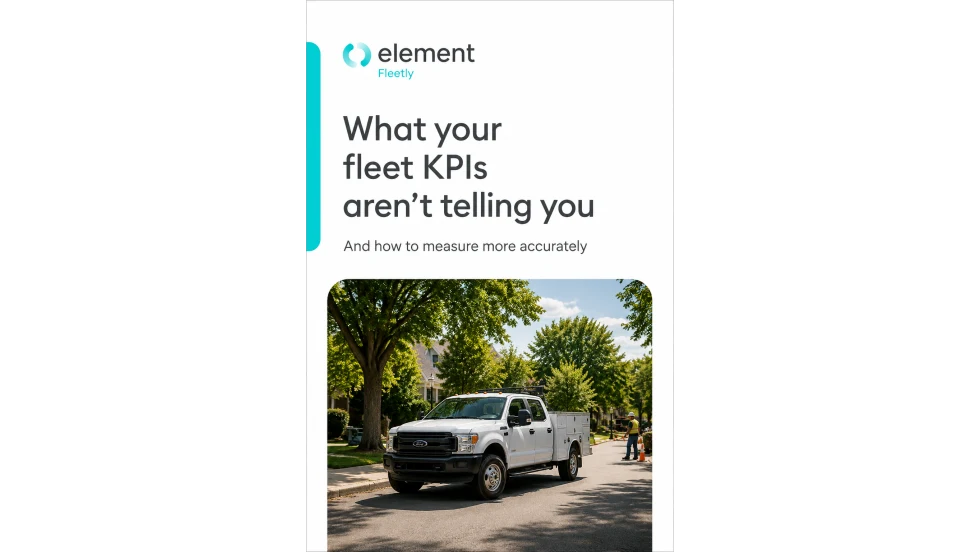
What Your Fleet KPIs Aren’t Telling You
Tracking fleet metrics is only useful when the data leads to better decisions. This guide helps fleet leaders assess cost, utilization, and downtime more accurately, identify performance gaps, and prioritize the actions that can improve operational results.
Read More →
Hidden in Plain Sight: Fleet Compliance Risks
Fleet compliance isn't just about having policies — it's about consistently enforcing them. This practical guide reveals six hidden compliance risks common in public sector and shared fleet operations and outlines proven strategies to improve visibility, accountability, and audit readiness
Read More →
Turning Fleet Payment Data into Executive Insights
Does data alone drive results in operations?
Read More →