



FLEET TALK: Establishing An Operational Expense System
It's obvious that whatever your product or service, your company's profit margin will suffer unless operating overhead is kept under control.
In this day and age of computers, high finance, the profit squeeze and "runaway" costs, we're all overwhelmed with reports, bulletins, and statistics of all kinds, for the specific purpose of controlling expenses. It's obvious that whatever your product or service, your company's profit margin will suffer unless operating overhead is kept under control. The only logical alternatives available are an increase in the price of your product (which would most likely place it at a competitive disadvantage) or the reduction of expenses. But to reduce expenses you first have to know what they are and, then, which ones to reduce.
All facets of the corporate operation are faced with this type of expense and must deal with operational control which permits the valuation of each category in relation and in light of material costs, work volume and payroll accounts. If, for example, material costs show an increase, investigation may disclose that the cost of paper or some other such commodity has gone up, or that perhaps an additional re port form was introduced. What ever the reason, management is able to pinpoint the increase and, more importantly, to take prompt corrective action when necessary.
This form of expense control is common practice in business management. Yet in fleet operations, we find too often that administrators have no detailed, current vehicle operating figures available to them, despite the fact that fleet expenses are often second only to salaries, Or at the other extreme we sometimes find administrators who keep statistics on every conceivable aspect of fleet operation. They have so many figures that they only serve to confuse and actually defeat their own purpose.
Inefficiency of "Total Expense"
For those who keep no statistics at all, or perhaps at best show them as a yearly, all-inclusive, "fleet operating expense" total, they only know that so much money has been spent. How can they possibly evaluate an increase, to what causes can they attribute it, and what can they suggest to correct it? Perhaps they just blame it on the increase in the cost of living and let it go at that. But can management be expected to accept that as a reason? Or is anything solved when a general bulletin is prepared and distributed commenting on the increase in expenses and making a broad statement to the effect that they must be reduced?
Operating Expenses
Fleet operating expenses comprise some 15 separate categories: lump them together and you have a nice round figure. For example, this round figure for the average, standard-size car with a V8 engine, automatic transmission, power steering and air conditioning which travels some 2,000 miles monthly will be approximately $160.00 a month. This total includes everything but administrative costs. On a yearly basis that comes to $1,920.00 per vehicle. With a 100 car fleet it grows to a total of $192,000, with 500 cars $960,000 and with a thousand cars $192,000!
Using the 1,000 car fleet as an example, a drop of only 1/2a mile per gallon in gas mileage could cost a company $24,000 over a year's time, without the administrator knowing the reason for it. If, on the other hand, statistics are available, the trend of lower gas mileage can be spotted when it first starts and corrective action can be taken immediately. That one savings alone can pay for at least a half a dozen clerks. Other examples of "controlled" savings are as follows: 2 quarts of oil per 6,000 miles equals 46 cents per vehicle per month; one set of tires over the life time of the car of some 50,000 miles equals $4.00 per month; and one wash job less per month comes to approximately $2.00 per vehicle per month. Multiply these expenses by the number of cars in a fleet and the figures become quite substantial.
Savings Possible
Regardless of operating methods or replacement practices, savings can he made. How else can one intelligently evaluate the type of equipment being used to do the job?
In order to be able to effectively control such operating expenses, however, the statistics maintained must be current, and to be current they must be regularly available. This doesn't necessarily mean that electronic data processing is the only answer-its' not unless your particular circumstances call for it and the size of your fleet is perhaps the single most important factor. When conditions are right, EDP is the only effective way of maintaining such statistics. On the other hand, for the relatively small fleet, manual posting and expense report analysis can do the job effectively.
Too many statistics can be as bad (if not worse) then none at all. The content, form and frequency of statistical reports should therefore be very carefully considered. Above all they should be prompt, current and simple to read. You must be able to pinpoint the problem areas quickly in order to take prompt corrective action.
Selection of Expense Items
Extremely important is the selection of those expense items which are to be included in your reports. They should be categorized and the proper format selected so that the statistics are shown to an advantage. Finally, the report frequency should be established. Generally speaking, fleet operating statistics can best be separated into three categories.
1. RUNNING COSTS
These include gas, normal repairs, tires, lubrication, and those expenses which arc directly related to mileage travelled and which should be shown cumulatively as "cents-per-mile."
2. INCIDENTAL EXPENSES
These include accident damage, washing, polishing, parking, storage, tolls, licenses and taxes, and miscellaneous. These are not directly related to mileage travelled and should be shown cumulatively as average "dollars-per-month." A cost-per-mile figure in this category has little meaning since the fluctuation in mileage will not cause the figure to rise and fall.
3. FIXED EXPENSE
These include rental in the leasing fleet, cost of money in a company owned fleet, depreciation reserve, insurance, etc. These expenses have no relation to mileage and are best interpreted in average "dollars-per-month" on a year to date basis.
These various statistics can of course be shown in more ways than indicated but the form shown is considered to be more appropriate for analysis and interpretational purposes.
Controllable Expenses
Items Number 1 and 2 above are considered to be in a "controllable" category in that it is possible to initiated corrective action. For example, low gas mileage can be a result of poor driving habits or the need for a tune-up or other repair, which can be corrected. Since this principle applies to all items in these two categories they should be included on this same report which can then represent your "control report."
Fixed Expenses
On the other hand, fixed expenses, item 3 above, are not generally considered controllable on a day-today or month-to-month basis. There is nothing that the operator can do to change them. Once your insurance rate is set, your depreciation reserve is established, your cost of money or leasing charge is in effect, there is little you can do to change them for the life of the car or the term of your lease or insurance policy. In fact, it might be argued that if the running and incidental expenses are properly controlled, the fixed expenses will take care of themselves.
Your control report should of course also include a miles-per-gallon figure and an average cost-per-gallon of gas; miles-per-quart of oil and the average cost-per-quart of oil; total mileage and average monthly mileage travelled. The grouping of expenses in this manner and the form in which these costs are shown are two of the more important considerations since they enable you to more easily interpret and analyze costs and at the same time permit prompt corrective action after the problem is recognized.
Form & Frequency of Report
The next consideration that should be made is the form itself and the frequency of the report. The set-up of the form used has great impact on the effectiveness of the report. It shouldn't be too crowded and it should be compact in size with the statistics clearly shown in proper sequence. This will eliminate the need for you to hunt for specific figures. It also permits easy scanning.
The running and incidental expense on your "control" report should be available for review on at least a monthly basis to permit you to take quick corrective action whenever it is warranted. These two categories of expenses on the one report are the "heart" of your report program. Fixed expenses are not required quite as frequently. The production of this particular report can be on a quarterly, a semi-annual or an annual basis and this would be sufficient. It's important also that they be on a separate report form, including all other expenses if desired, in order to provide a complete budgeting type of report.
Use of EDP
Where electronic data processing is used, it is highly recommended that an "analysis by exception" feature be incorporated in your reports. This would involve establishing both a high and a low tolerance for selected items of expense. Two methods can then be used-either "flagging" the exceptions on a complete report or printing only the exceptions as they are made. This becomes actually a matter of preference. But either way it eliminates the need to hunt for and pick out the problem areas. In fact, to suit your particular needs you can incorporate in your program many other similar types of exception reporting or controls. You can perhaps include a replacement formula which would print out those cars as they reach replacement time either based on mileage and/or age, or on performance of the car itself. In addition you can incorporate an exception feature which would keep tabs on required maintenance. There is actually no end to the combinations which can be worked into such a program.
Limiting Data
It's important too, when establishing the initial program, to arrange for the pick-up and identification of all the operating statistics deemed necessary. Don't attempt to include all of them on a regular report, since this would only tend to confuse the result. Rather, once they have been picked up they can be "recalled" at any time to produce whatever special type of report you may deem necessary at various intervals. Your regularly produced reports should include only those expenses we mentioned earlier, which lend themselves to control.
There is one additional report which you can provide. This represents a final report on all vehicles as they are retired from service, to give a total, lifetime expense picture of each car.
Category-Expense Advantages
Another advantage of grouping your operating expenses by category is that, of all operating costs, only running expenses (on a cost-per-mile basis) lend themselves to a meaningful comparison with other similar fleet operations. The policies governing both incidental and fixed expenses can vary too widely between fleets to mean much on a comparative basis.
The analysis of these reports and the corrective action taken should also follow a pattern of priority. While all expenses bear close scrutiny and obviously have an impact on overall costs, consider the fact that depreciation and gasoline costs alone will normally represent better than 60% of your total operating costs. However, since depreciation depends on the initial selection of make, model and. equipment, replacement policies, as well as the day-to-day care and maintenance of the vehicle, it cannot-by itself, be considered as "controllable". What is required is the effective control of all factors on which it depends.
Priority of Gas Expense
This leaves us with gasoline as the largest controllable operating expense item. It is also by far the most important, not only because of the gas expense in itself, but because it also can be an indication of existing or potential problems elsewhere. As an example, continued low gas mileage can be an indication of excessively high speed operation or of poor driving habits, Both can in turn adversely affective wear, oil consumption, repair, the incidence of accidents and the general physical appearance of the car itself. Therefore, in view of this, your gas mileage figure should be analyzed very closely to determine what effect it may have on other areas of running costs.
Oil & Filter Changes
Going hand in hand with the analysis of the gas mileage and gasoline costs per mile is a close watch on the oil and. oil-filler change. While the overall expense involved in this operation is not great in itself, it is important that the scheduled changes arc closely adhered to. This is particularly importanttoday due to the air pollution controls which are part of the engine. Those include the positive crank case ventilation system and the exhaust emission control system which almost literally result in a "sealed" engine. Serious engine damage can result when this service is neglected, so a regular check is a "must" to assure its completion.
Since these two areas of expense and maintenance are perhaps the most important they require primary attention and as such should be highlighted on regular report forms.
Conclusions
In the final analysis, once effective replacement, maintenance, and inspection programs are established, and are adequately covered by written procedures and manuals, it is the control of the day-to-day operation of fleet vehicles which can mean the difference between success and failure of an entire fleet operating program.
The savings possible are endless. However the control depends on the availability of selected operating statistics which are current, easy to read, and provide the means for prompt corrective action. You can buy right and sell right, but unless that period in between properly controlled, you are spinning your wheels.
This single phase of fleet operation best tests the skill, and the value of the fleet administrator.
More Operations

Reading the Global Signals: What AI and the Energy Transition Mean for Fleets Now
How can fleet managers navigate a never-ending, changing industry landscape?
Read More →
90% Use Telematics. Are Fleets Getting Safer? | AF News Recap
This week, we're breaking down which industries have the highest rates, how Jamie McKay manages 2,400 vehicles, what's happening with the 2027 fleet awards, and why software-defined vehicles could introduce new costs.
Read More →
What's Best Handled by an FMC, and What's Better Done Directly?
Fleet managers continue to rely on FMCs for essential services but are taking a closer look at where working directly with suppliers can improve efficiency and responsiveness.
Read More →
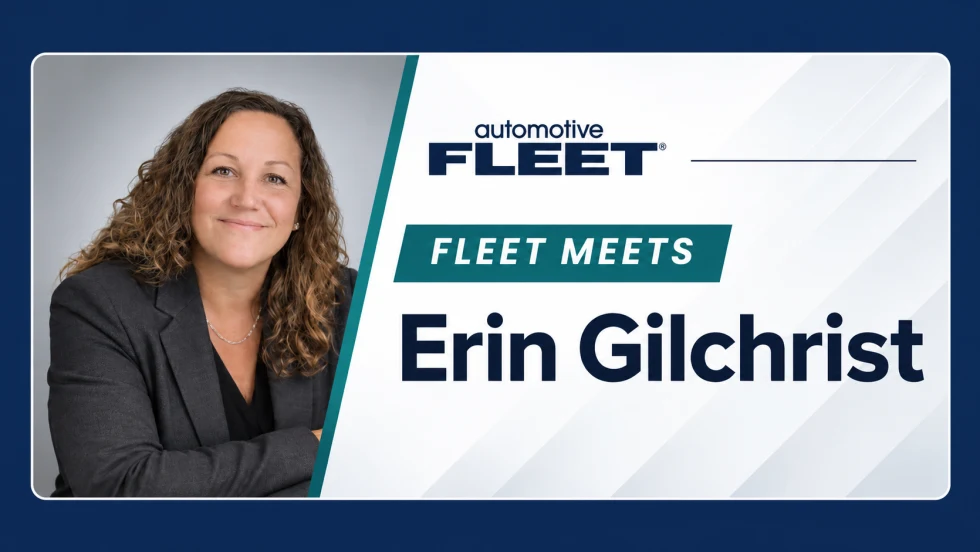
Fleet Meets: Erin Gilchrist
Meet Erin Gilchrist, the inaugural Mike Antich Spirit of Fleet Award winner, as she shares insights on leadership, mentorship, the power of industry connections, and why people remain at the heart of fleet's future.
Read More →
How 2026 Fleet Visionary Jamie McKay Manages 2,400 Vehicles Across 37 States
How do you keep 2,400 vehicles running across 37 states? Fleet Visionary Award winner Jamie McKay shares how collaboration, flexibility, and a few simple strategies help her tackle fleet management challenges at Aptive Pest Control.
Read More →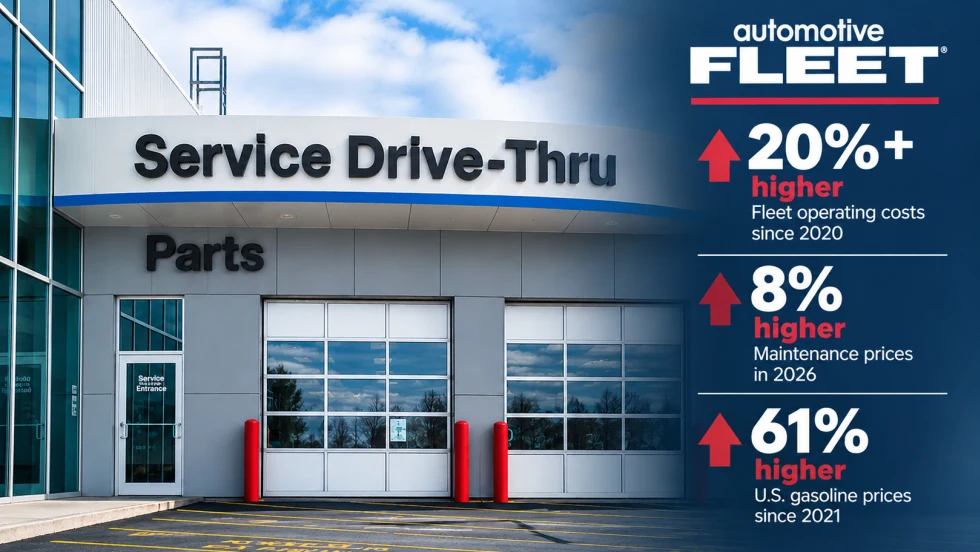
Managing Fleet Costs in an Era of Permanent Volatility
Fleet operating costs have risen more than 20% since 2020, raising a key question: When does extending a vehicle's service life stop making financial sense?
Read More →
The Next Evolution of Fleet Management: Autonomous Operations
This opening keynote session at the Fleet Forward Conference highlights the future of autonomous driving for fleets.
Read More →
How to Reduce the Total Cost of Risk From Catalytic Converter Theft
A stolen catalytic converter can cost fleets far more in downtime and lost productivity than in repairs. A total-cost-of-risk approach can help fleet managers quantify their exposure and prioritize theft prevention.
Read More →
Personal-Use Charges Rise as Vehicle Values Fall | AF News Recap
Personal-use charges are climbing, wholesale used-vehicle values are declining, and commercial fleet sales growth is slowing. This week, we're breaking down the latest fleet data, plus how Element Fleet Management is helping Waymo prepare for its first Canadian robotaxi market.
Read More →
Here's When You Should Make an Exception to Fleet Policy
Fleet policies are designed to create consistency, but not every driver or situation fits neatly within standard rules.
Read More →