

Driver Behavior Improves, ARI's Driver Scorecard Shows
The second annual Driver Scorecard Benchmarking Survey, with data provided by ARI, followed up on the results from the inaugural benchmark. This year, ARI provided data from 80,000 vehicles.


Photo courtesy of istockphoto.com

Photo courtesy of istockphoto.com
Last year, Automotive Fleet partnered with ARI to aggregate driver behavior data in order to use it as an industry benchmark to assess driver behavior behind the wheel of all types of company cars. The result would be Automotive Fleet’s first-ever Driver Scorecard Benchmarking Survey.
This year’s benchmarking survey follows up on last year’s survey in order to track how driver behaviors have evolved, and to identify best practices.
The categories the benchmarking survey tracked were: excessive idling, speeding, aggressive acceleration, harsh braking, fuel consumption variation, PM compliance, maintenance cost variation by drivers in comparable vehicles, parking tickets and citations for moving violations, seat-belt usage, cellphone usage while driving, and vehicle crash rates.
With a year’s worth of collected data from 80,000 vehicles, the data this year is indicating that driver behavior has improved.
“In a year-over-year comparison, every category saw significant reductions in the number of incidents, which is a direct reflection of the use of driver scorecards and the power of actionable data,” said Tony Candeloro, vice president, Product Development and Client Information Systems, ARI.
“Big Data” isn’t new in the fleet industry, Candeloro noted. However, a fleet having the ability to use “Big Data” in a strategic way is a more recent development, he added. Fleets today, can access both an overall view of fleet operations and a more granular view of exactly what is going right and what is going wrong, he said.
“Tools like driver scorecards now bring together data from different sources and different devices into a single, manageable dashboard that displays the information in a clear and intuitive way,” he said. “They also allow users to drill down into different categories to gain deeper insight into specific areas. And, they highlight anomalies and problems quickly so a fleet manager can investigate and take action quickly.”
The data from this year’s survey shows the impact that data and technology can have on driver behavior and safety, he added.
“Data and technology are giving companies the ability to strategically manage their fleets in a way that was never possible before, and this is driving the ability to understand the investment a company makes in its fleet and uncover savings while implementing best practices,” Candeloro said
Excessive Idling
AF: Compared to the year before it, did excessive idling increase or decrease. Were there differences between asset types?
Candeloro: Compared to 2016, there was a significant reduction in idling events across every segment. The decrease seen among van fleets is especially notable. In 2016, the percentage of excessive idling events for vans was 10.6%; in 2017, it dropped to an astounding 1.6%. Steep drops were seen with the light-duty and medium-duty segments as well, although there was not as much of a drop for the medium-duty segment.
AF: What factors contributed to the decrease? Both overall and per asset type, if there were noticeable differences between types.
Candeloro: This significant decline in idling events can be directly attributed to an increasing number of fleets adopting the use of driver scorecards to measure the behavior of their drivers and proactively assign training to drivers in response to an evaluation of their driving habits. Companies have always appreciated the toll excessive idling can take on a fleet — everything from fuel consumption to preventive maintenance schedules can be negatively affected by excessive idling.
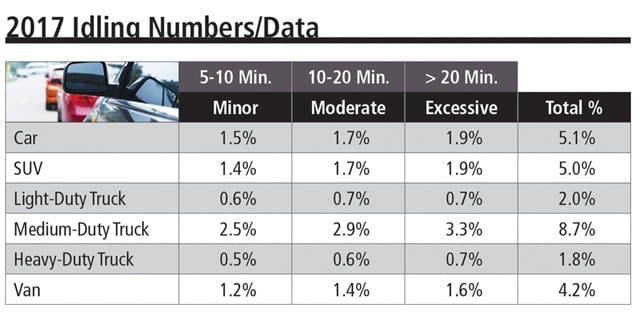
Chart courtesy of ARI.
Increasingly however, fleets are able to use real-time data combined with tools like driver scorecards that make it easy to see what is happening across your fleet. Fleet managers can pinpoint which drivers may not be following the company’s guidelines when it comes to idling and take immediate action. The rising number of fleets with access to the kinds of tools that empower them to make truly impactful decisions is reflected in this year’s numbers.
AF: What are some best practices fleet managers can follow to continue the trend of decreased idling? Any recommendations on a per-asset-type basis?
Candeloro: I think a review of the numbers between 2016 and 2017 clearly shows the power of data and the effect driver scorecards are having across the industry. Fleets that have adopted the use of scorecards are seeing a genuine impact when it comes to decreasing excessive idling regardless of the asset type.
And, while there are technologies that can be installed on a vehicle to help manage idling time such as automatic shut-offs, driver training remains the No. 1 way to effectively manage idling. Helping drivers understand the impact of idling on fuel economy and preventive maintenance schedules can compel drivers to change their behavior. Together with the data and the use of a driver scorecard, the modern fleet manager is truly empowered to make changes that have a positive effect on the bottom line
Speeding Numbers/Data
AF: Compared to the year before, were there more or less instances of speeding? In the instances where speeding occurred, how fast were the vehicles going? Did this vary between asset types?
Candeloro: For the most part, there was a slight reduction in the numbers related to speeding from 2016 to 2017, although there was a very small uptick with regard to medium-duty truck fleets. In terms of speed, the chart distinguishes between vehicles going 80-90 mph, 90-100 mph, and over 100 mph.
In 2016, there was data showing speeds at over 100 mph in the car segment; this year, no segment reported having had any incidents of speeding over 100 mph, so that is a meaningful improvement. The increase in minor infractions for medium-duty trucks affected the overall total for that category.
AF: What factors lead to speeding?
Candeloro: Any number of factors can lead a driver to drive above the speed limit. A fleet that doesn’t have a clear and well-communicated safety policy can leave drivers without an understanding of the company’s expectations and the driver’s responsibilities. Often, it is also the circumstances that can lead to speeding — anything from excessive congestion to running late can result in a driver going above the posted speed limit or driving at a speed that is unsafe for the specific conditions.
AF: What caused the year-over-year decrease? Both overall and per asset type, if there were noticeable differences between types.
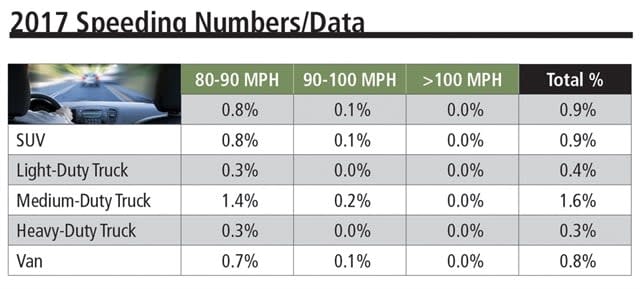
Chart courtesy of ARI.
Candeloro: Like the decrease that was seen with idling, the decrease in speeding from year to year can be directly tied to the increasing adoption of driver scorecards. Scorecards give fleet managers real-time awareness regarding what is happening with their drivers out on the road and helps them to take steps to prevent accidents by correcting behavior with training. Speeding is the kind of behavior that can be changed with the right communication and the right training.
AF: What are best practices to reduce driver speeding?
Candeloro: First and foremost is to have a solid driver safety policy in place and communicate that policy with your drivers. Second: training, training, training. Helping drivers understand the implications of speed, weight, momentum, and traction can lead to them becoming better, safer drivers. Also, be sure to emphasize that “excessive speed” not only means exceeding the speed limit — it also means going too fast for the current conditions, even though the vehicle may be traveling less than the speed limit. Drivers must know how to safely manage their vehicle in all kinds of conditions.
The data also shows that fleets that take a proactive approach to implementing a driver scorecard program will see tangible benefits with regard to driver behavior and lower costs. Having a policy in place, communicating that policy and offering training all go a long way toward ensuring your drivers are acting in a safe manor when out on the road. But technology and data can empower a fleet manager to not only take those proactive steps, but also measure the results of those steps. They can know if a driver is following the established policy or needs additional training. The scorecard also allows fleets to incentivize drivers, because the data is a solid reflection of their behavior. Setting goals for the fleet and rewarding those who meet those goals according to the measured results is a way to motivate and support good driving habits.
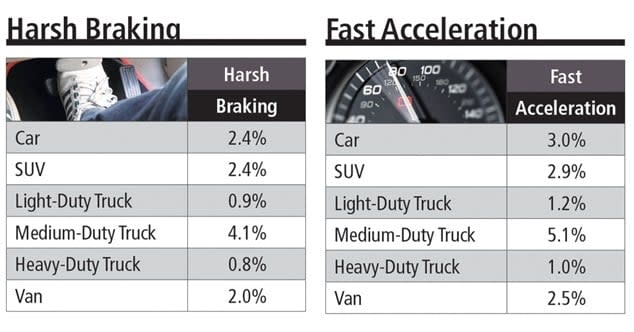
Aggressive Acceleration Numbers/Data
AF: Compared to the year before it, did instances of aggressive acceleration & harsh braking / sudden deceleration increase or decrease? Did this vary by asset type?
Candeloro: Compared to the prior year, there was a decrease in both the number of aggressive accelerations and harsh braking incidents in every segment. The van segment saw a particularly notable decrease in both measures, going from 10.8% in 2016 to 2.5% in 2017 with regard to aggressive acceleration, and going from 8.5% in 2016 to 2% in 2017 with regard to harsh braking incidents.
AF: What factors lead to aggressive acceleration? What factors lead to harsh braking? Does asset type affect this? What caused the decrease from year to year?
Candeloro: Like most other unsafe driving behaviors, aggressive acceleration and harsh braking are often due to drivers who may not be aware of the company’s policy and may not have been properly trained with regard to safe driving techniques.
The variance between asset types is not especially significant. But asset type can affect how a fleet may want to instruct a driver. For example, a larger vehicle requires more power (and usually more time) to accelerate. While you may see fewer aggressive accelerations with a larger vehicle, you need to be sure your drivers understand that larger vehicles are also harder to stop and thus they need to be aware of what it will take to slow that vehicle to a complete stop safely.
AF: What are best practices in preventing aggressive acceleration/harsh braking?
Charts courtesy of ARI.
Candeloro: Ensuring your drivers know the dangers of aggressive acceleration and harsh braking is important. These behaviors can lead to problems on the road just like speeding can, but depending on a driver’s level of experience, they may not realize the danger of such behavior. Additionally, such actions waste fuel and increase the wear and tear on the vehicle.
Implementing a driver scorecard program, together with a well-communicated policy and targeted training can help fleet managers create a strategic approach to managing these issues. No longer do you have to wait for an incident to occur as a result of these behaviors; a driver scorecard allows a fleet manager to see these events — even if nothing came of it — and assign training accordingly. Data and a solid driver scorecard program can now be a fleet manager’s “early warning system” that corrections need to be made. And it isn’t done by guesswork — it is done by using accurate, real-time data.
Fuel Consumption
AF: What are best practices when it comes to reducing fuel consumption?
Candeloro: Fuel remains one of the largest costs to a fleet, even though prices at the pump have been lower in recent years. Having drivers understand that they can have a significant impact on fuel consumption can go a long way toward keeping costs under control.
Aggressive driving can reduce miles per gallon by as much as 33%. Comparatively, safe driving techniques tend to promote conservative fuel usage — so adopting a driver scorecard and communicating with drivers about what behaviors are best (following the speed limit, minimizing excessive idling, avoiding aggressive acceleration and harsh braking) can help in managing fuel costs. Fleet managers should also encourage drivers to anticipate traffic flow and red lights, and avoid tailgating. They should also check to be sure that their vehicle is not carrying excess weight. On average, each 100 pounds of excess weight reduces fuel efficiency by as much as 2%.
Vehicle maintenance — especially preventive maintenance — also plays a large part in reducing fuel consumption. Keeping a vehicle’s tires properly inflated and aligned is important as well. Improper alignment not only causes uneven tire wear, misaligned or damaged parts of the suspension or chassis can create drag which will in turn affect fuel consumption. Additionally, keeping tires properly inflated can improve fuel efficiency by as much as 3.3%.
Preventive Maintenance Compliance
AF: What are best practices to improve PM compliance?
Candeloro: Preventive maintenance (PM) requires the ability to monitor fleet data and an understanding on the part of the drivers about the importance of getting the PM work done. Partnering with an FMC or adopting a fleet maintenance system will support the monitoring of fleet data. Like every other area of fleet, Big Data is having a positive impact on the ability of fleet managers to see how a vehicle is performing and when there might be an issue.
The key is to have the right tools and technologies in place that help to manage and interpret the data so that you are not overwhelmed by the volume of information. Instead, the goal is to clearly see potential outliers that may be driving up costs. Like a driver scorecard, a fleet health card is a tool that can provide a comprehensive view of a company’s fleet, and help a fleet manager drill down into different areas to get a more granular view of what is happening in real-time. This empowers a fleet manager to make decisions and take proactive action — like adjusting a PM schedule if needed — with confidence because such actions are based upon actionable data.
It is also important to create a structured PM program that follows manufacturer guidelines and incorporate that program, and its requirements, into your overall driver policy. Additionally, communicate with your drivers about the significance of PM. Getting their buy-in and cooperation, together with the data will create an environment where preventive maintenance is just as important as any other safety measure that a driver can take. It will also help toward managing costs and improving total cost of ownership.
Maintenance Cost Variation by Drivers in Comparable Vehicles
AF: What are best practices to further minimize maintenance cost variation?
Candeloro: Tracking maintenance data and developing a structured preventive maintenance program according to manufacturer specifications and recommendations can help to minimize cost variation. Tracking and analyzing the data is critical — if you do not know what is happening to your fleet, there is no way to know if there is any variation.
Having tools to help track and analyze maintenance data is good; having tools that not only track and analyze the data, but also helps identify outliers and anomalies or variances in real-time is even better. Again, like a driver scorecard, a fleet health card is a useful tool to help you understand if there is a specific segment or area of your fleet that is incurring more costs that usual. By highlighting the outliers, this tool saves time (and money) that would otherwise be spent reviewing reports searching for an answer.
Parking Tickets and Citations for Moving Violations
AF: What are best practices to further reduce the rate of parking and other moving violations?
Candeloro: Tickets and violations can be a big risk and a big expense for fleets if they do not have a program in place to deal with them appropriately. It is important to have both a clearly communicated policy in place and a system of reporting that assigns responsibility for such infractions to the driver.
The policy should clearly define what the responsibilities of the driver are when violations occur. And, having a system in place to do rolling MVR checks can help identify any gaps with regard to reporting. Finally, as part of a larger safety training program, consider training specifically on violations as a way to reinforce what is expected of a driver.
Seat Belt Usage
AF: What are best practices to further increase seat-belt usage?
Candeloro: Seat belts remain one of the most important things a driver can do to protect themselves behind the wheel. According to the Centers for Disease Control and Prevention (CDC), more than half of teens and adults (age 20-44 years old) who died in crashes in 2014 were unrestrained at the time of the crash. The CDC estimates that seat belts reduce serious crash-related injuries and deaths by about half. The good news is that according to the National Highway Traffic Safety Administration (NHTSA), seat belt use reached 88.5% in 2015.
Making seat belt usage a mandatory requirement as part of an overall driver safety policy and including the risks of not wearing a seat belt part of driver training can go a long way toward ensuring seat belt use among fleet drivers. Using the data that is compiled from a driver scorecard program to incentivize drivers is also a way to increase seat belt usage and general safe driving behaviors.
Cellphone Usage While Driving
AF: What are best practices fleet managers can follow to further reduce cellphone usage?
Candeloro: Companies with fleets need to be clear about strictly prohibiting cellphone usage while driving, communicate that prohibition via company policy, reinforce that message through training, and vigorously enforce any repercussions whenever there is a violation.
Helping drivers to understand why distracted driving is so dangerous, in addition to emphasizing the organization’s policy about distracted driving, can help to gain buy-in among drivers. According to NHTSA, in 2014, 3,179 people were killed, and 431,000 were injured in motor vehicle crashes involving distracted drivers. And, research indicates that having a hands-free conversation doesn’t significantly reduce the chances of a crash. Incorporating important statistics into your overall safety training on cellphones and distracted driving and making safety a priority can support a decrease in cellphone usage.
Vehicle Crash Rate
AF: What best practices can be followed to further decrease the vehicle crash rate?
Candeloro: The answer to this continues to be technology and training. Tools like a driver scorecard give fleet managers the ability to see bad driver behavior and take steps to correct it before a crash ever happens. A driver that is receiving poor scores when it comes to speeding can be assigned training to help address that issue. And, as a proactive measure, fleets can incentivize good behavior by offering rewards for drivers who receive good scores. Ultimately, it is the data, technology and tools, and the steps taken once those things are in place (i.e. training) that will have a long-term impact.
More Safety

Top 50 Executive Fleets
It is that time of year again! Time for the 2026 list of the Top 50 Executive Fleets, presented by Automotive Fleet and Volvo as part of its annual Fleet 500. Download now to see this year's list of companies!
Read More →
How Better Visibility Cut Speeding Violations by 48%
Fleet leaders don't need more data, they need clearer visibility into what the data is saying. This case study explores how one utility replaced speeding-event counts with a single metric — miles driven in violation — to strengthen safety and significantly reduce speeding violations.
Read More →
Operation Safe Driver Week: Why the Industry's Oldest Safety Campaign Still Matters to Fleets
A look at how a 2007 enforcement initiative became one of the most consequential weeks on the fleet safety calendar, and what it means for your drivers in 2026.
Read More →
Nexar-Nauto Merger Aims to Give Fleets Better Safety Intelligence Through Larger Driving Dataset
Stefan Heck tells Automotive Fleet that combining more than 10 billion miles of driving history with Nexar's AI models will give fleets deeper insights into driver risk and roadway conditions than either company could provide independently.
Read More →
From Silos to Solutions: Relationship Management for Safer Fleets
From telematics adoption and driver accountability to policy consistency and risk mitigation, this episode breaks down what it really takes to build a safer fleet culture without slowing business down.
Read More →
IIHS Launches First Commercial Vehicle Safety Evaluations
The Insurance Institute for Highway Safety has begun evaluating heavy-duty pickups and cargo vans for driver protection. Which models earned top marks?
Read More →
Reducing Risk by Eliminating Phone Use Behind the Wheel
Hosted with the cofounder of Lifesaver Mobile, this episode addresses phone use behind the wheel and how to design a driving environment that actually helps prevents accidents.
Read More →
Cameras, Safety and Insurance: From Reactive Claims to Real-Time Prevention (Part 2 of 2)
Part Two: Commercial auto remains one of the most challenging and costly lines of coverage for fleet operators and insurers alike. Continue learning more about how to effectively address these issues from Onur Aksan, Enterprise Business Development Executive, Geotab
Read More →
How 5-Second Telematics Data Is Changing Fleet Safety
This episode connects with Steve Santostasi of Ford Pro and covers how a few seconds of data can make a difference in fleet safety.
Read More →
The Two Biggest Summer Downtime Threats for Fleets
A conversation with a maintenance expert reveals the two most common summer maintenance pains and how to prevent them.
Read More →