


Read More: U.S. Ranks Third as Most Dangerous Country to Drive
Which States Have the Most Dangerous Roads?
A new analysis from 1-800-Injured ranks states for most dangerous roads according to various fatality data and assesses the best and worst quality of roads across the nation.
June 1, 2022

In the U.S., nearly 43,000 people died in crashes in 2021. A recent analysis evaluates states for roadway danger.
Photo: PxHere.com
3 min to read
Mississippi ranks as the state with the most deadly roads, having scored the highest overall Road Danger Rating of 9.93 in a recent analysis from 1-800-Injured.
To determine how dangerous a state’s roads are, 1-800-Injured looked at a number of factors: fatality rates per 100,000 population, per 100,000 vehicle miles traveled, per number of licensed drivers, as well as road quality. Then they crunched the numbers and combined them into a single Road Danger Rating.
Mississippi, for example, has the highest road fatality rate compared to its population, with 25.39 deaths per 100,000 people. The state also sees 18.96 road deaths for every billion vehicle miles traveled — which is the second highest of all states.
Rank | Size | Motor Vehicle Fatalities | Vehicle Miles Travelled (VMT) (Millions) | Fatality Rate per Billion VMT |
1 | South Carolina | 1,064 | 53,972 | 19.71 |
2 | Mississippi | 752 | 39,665 | 18.96 |
3 | Arkansas | 638 | 33,919 | 18.81 |
4 | Montana | 213 | 12,104 | 17.60 |
5 | Louisiana | 828 | 48,374 | 17.12 |
6 | Kentucky | 780 | 46,536 | 16.76 |
7 | New Mexico | 398 | 23,756 | 16.75 |
8 | West Virginia | 267 | 16,054 | 16.63 |
9 | Arizona | 1,054 | 65,758 | 16.03 |
10 | Florida | 3,331 | 208,076 | 16.01 |
Other states that ranked among the top five for road danger include Arkansas and South Carolina, both with an overall road danger rating of 9.59, followed by Montana (9.12) and New Mexico (8.98).
In joint second place are Arkansas and South Carolina. Arkansas had the higher fatality rate compared to population at 21.19 versus South Carolina’s rate of 20.79. But South Carolina had an incredibly high rate of deaths compared to vehicle miles traveled — specifically, 19.71 as compared to Arkansas’ 18.81.
The report also assesses road quality among all states. Rhode Island is the state with the worst quality road surfaces in the country, receiving a score of just 0.61. Rhode Island has the highest percentage of its roads rated “poor” for roughness, while also having one of the highest proportions of roads with heavy cracking.
Louisiana has the second-worst quality roads in the nation. Louisiana’s roads suffer from particularly high levels of rutting, with 14.35% of roads being affected.
New York earns third place for worst road quality. The Empire State’s roads suffer from a high rate of cracking and a moderately high rate of rutting, while also having one of the largest proportions of its roads rated “poor” for roughness.
As for places with the best quality roads, Nevada takes the top spot on the 1-800-Injured list with an overall Road Quality score of 8.98. With the second-lowest percentage of roads rated “poor” for roughness, Nevada also had very low levels of heavy cracking and rutting on the state’s road system.
South Dakota and North Dakota take second and third place, respectively, for best quality roads. South Dakota earned a road quality score of 8.78. The state did very well for having hardly any road surfaces with high levels of cracking or rutting. North Dakota’s road quality score is 8.44. This is due in part to the state having the lowest levels of heavy road cracking in the entire country.
More Safety

Sponsored•July 17, 2026
How Better Visibility Cut Speeding Violations by 48%
Fleet leaders don't need more data, they need clearer visibility into what the data is saying. This case study explores how one utility replaced speeding-event counts with a single metric — miles driven in violation — to strengthen safety and significantly reduce speeding violations.
Read More →
Operation Safe Driver Week: Why the Industry's Oldest Safety Campaign Still Matters to Fleets
A look at how a 2007 enforcement initiative became one of the most consequential weeks on the fleet safety calendar, and what it means for your drivers in 2026.
Read More →
Nexar-Nauto Merger Aims to Give Fleets Better Safety Intelligence Through Larger Driving Dataset
Stefan Heck tells Automotive Fleet that combining more than 10 billion miles of driving history with Nexar's AI models will give fleets deeper insights into driver risk and roadway conditions than either company could provide independently.
Read More →

Sponsored•July 2, 2026
From Silos to Solutions: Relationship Management for Safer Fleets
From telematics adoption and driver accountability to policy consistency and risk mitigation, this episode breaks down what it really takes to build a safer fleet culture without slowing business down.
Read More →
IIHS Launches First Commercial Vehicle Safety Evaluations
The Insurance Institute for Highway Safety has begun evaluating heavy-duty pickups and cargo vans for driver protection. Which models earned top marks?
Read More →
Reducing Risk by Eliminating Phone Use Behind the Wheel
Hosted with the cofounder of Lifesaver Mobile, this episode addresses phone use behind the wheel and how to design a driving environment that actually helps prevents accidents.
Read More →
Sponsored•July 1, 2026
Cameras, Safety and Insurance: From Reactive Claims to Real-Time Prevention (Part 2 of 2)
Part Two: Commercial auto remains one of the most challenging and costly lines of coverage for fleet operators and insurers alike. Continue learning more about how to effectively address these issues from Onur Aksan, Enterprise Business Development Executive, Geotab
Read More →
How 5-Second Telematics Data Is Changing Fleet Safety
This episode connects with Steve Santostasi of Ford Pro and covers how a few seconds of data can make a difference in fleet safety.
Read More →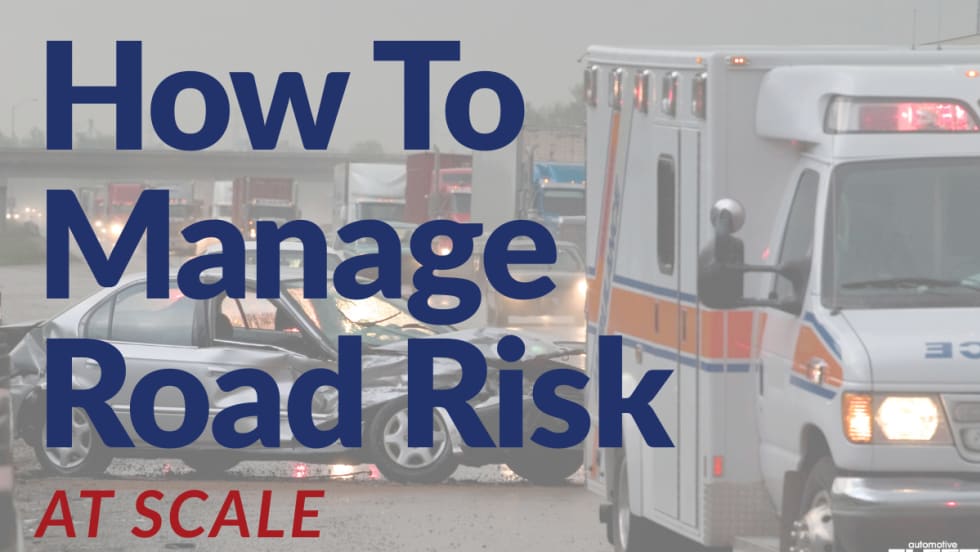
Managing Road Risk at Scale: Why Fleet Safety Needs a Data-Driven Framework
Insights from the FIA Road and Driver Safety Indexes reveal how to manage road risk on a larger scale.
Read More →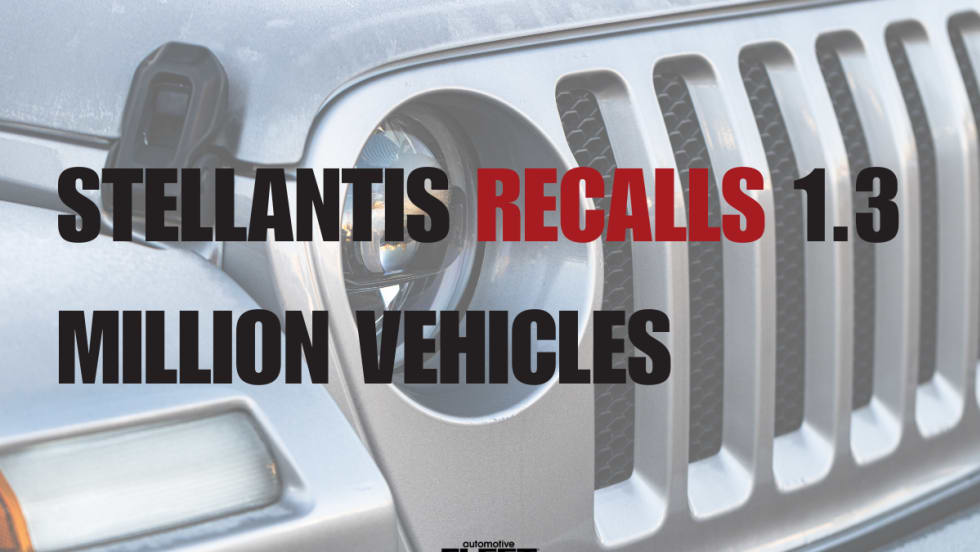
Stellantis Recalls 1.3 Million Jeep Vehicles Worldwide Over Fire Risk
Stellantis is recalling more than 1.3 million Jeep Wrangler and Gladiator models worldwide over a fire risk linked to power steering pump wiring.
Read More →