


Learn More:Where's The Fleet Pain on Tariffs?
2026 MY Vehicle Prices Rise Across The Market
Of 31 major brands tracked by Kelley Blue Book, only five recorded transaction prices in August lower than year-ago levels.
September 10, 2025
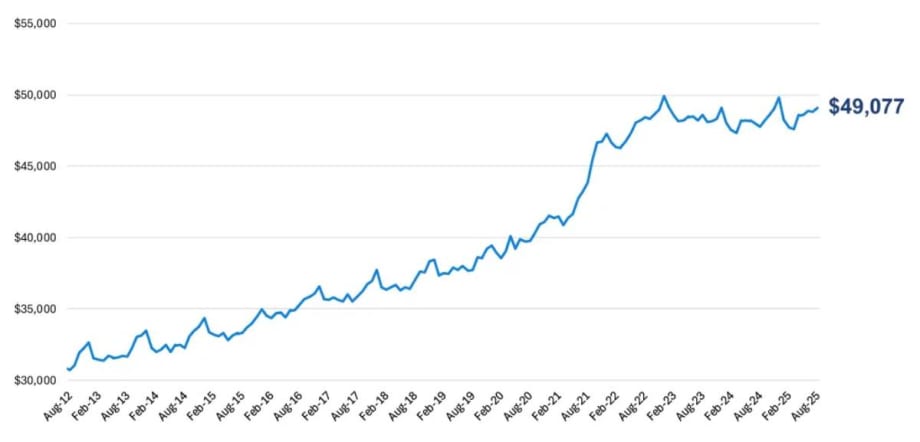
The new-vehicle ATP was $49,077 in August, up 0.5% from July ($48,841) and higher year over year by 2.6%. The annual gain of 2.6% in August was the largest gain in more than two years, although it remains below long-term averages.
Graphic: Cox Automotive
4 min to read
New-vehicle prices moved higher in August as more model year 2026 vehicles hit dealer lots and automakers work to offset higher costs, according to estimates from Kelley Blue Book released Oct. 10.
Price increases accelerated in August as both key measures – average transaction price (ATP) and manufacturer’s suggested retail prices (MSRPs) – increased month over month and year over year. Despite higher prices, retail sales in August climbed by 2.5% versus year-ago levels.
The new-vehicle ATP was $49,077 in August, up 0.5% from July ($48,841) and higher year over year by 2.6%. The annual gain of 2.6% in August was the largest gain in more than two years, although it remains below long-term averages.
The average new-vehicle MSRP – commonly called “the asking price” – in August was $51,099, an increase compared to July and higher year over year by 3.3%, a rate of increase very close to long-term averages and the largest gain in 2025.
Incentives spending softened, falling to 7.2% of ATP in August from 7.3% in July. Compared to a year ago, new-vehicle incentive spending is mostly unchanged. In fact, over the past year, incentive spending has held relatively steady, averaging 7.2% of ATP, with the highest incentive spending in the final months of 2024 and the lowest in April 2025.
Most automakers posted price increases year over year in August. Of 31 major brands tracked by Kelley Blue Book, only five recorded transaction prices in August lower than year-ago levels. Acura (down 6.5%) and Tesla (down 5.5%) led the way, with three Stellantis brands all lower by less than 1%: Dodge, Ram and Chrysler. All other major brands saw prices increase in August. Seventeen brands saw price gains in excess of 3%.
Full-size pickups, now commonly available with EV and hybrid powertrains, continue to push the industry’s ATP higher. Of the 10 best-selling vehicles in the U.S., four are full-sized pickup trucks, with the Ford F-Series ($66,934) and Chevrolet Silverado ($61,023) firmly in the top two spots. The GMC Sierra ($70,150) is No. 7 on the list. The Ram pickup ($65,849) is No. 9. (Note: The Kelley Blue Book ATP is an average of all vehicles sold each month, so big sellers influence the number more than low-volume vehicles.)
“While new-vehicle prices continue their upward trajectory, the pace of change remains relatively measured, more a gradual correction than a seismic shift," said Erin Keating, executive analyst of Cox Automotive, in a Sept. 10 news release. "Costs are clearly increasing for automakers, dealers, and buyers alike. This month’s increase aligns with our expectations, reflecting a market that’s adjusting to new production realities and consumer preferences without tipping into volatility.”
Electric Vehicle Sales Hit New Record in August
Sales of electric vehicles reached a record 146,332 in August, according to initial Cox Automotive estimates. EV share last month was a record 9.9% of total sales and higher than the July share of 9.1%. With government-supported EV tax credits set to expire at the end of September, current sales trends suggest Q3 2025 will set an all-time record for EV sales in the U.S. (The current record is Q4 2024: 365,824.)
The initial estimate of the EV average transaction price in August was $57,245, up 3.1% from the revised lower EV ATP of $55,562 in July. Year over year, EV prices were mostly unchanged, lower by 0.1%. The higher volume of EV sales helped push the overall industry ATP higher as well.
EV incentives in August were down from the July record, but at 16% of ATP, EV incentives remain more than twice as high as the overall market. The average incentive package on a new EV was more than $9,000 in August. A year ago, incentive packages for EVs averaged 13.6% of ATP.
Tesla, the leading EV seller in the U.S. by far, saw ATPs climb 2.9% in August to $54,468. Compared to a year ago, ATPs in August were lower by 5.5%. Tesla’s sales last month were lower year over year by 6.7% and the EV leader’s share of all EV sales in the U.S. fell to 38% last month, the lowest point in the modern EV era.
“The one constant in the automotive business is that fresh product sells well," said Stephanie Valdez Streaty, senior analyst at Cox Automotive. "While Tesla’s Model Y update has slowed the company’s sales decline, it’s not getting easier for the EV pioneer because the market is flooded with all-new, fresh EVs from mainstream competitors — consumers have more choice than ever. The surge in EV sales is being driven by product innovation, motivated dealers, and an urgency ahead of the IRA tax credit phase-out.”
More Vehicle Research

Sponsored•July 23, 2026
The Top 300 Commercial Fleets
The Top 300 Commercial Fleets: See the List
Read More →
2027 Toyota Prius Receives Technology, Comfort Update
The hybrid adds dual-zone climate control for 2027 while retaining its fifth-generation hybrid system and Toyota Safety Sense 3.0.
Read More →
Leaders, Data, and the Future of Mobility | AF News Recaps
From Fleet Manager of the Year finalists to connected vehicle privacy and the future of urban mobility, this week's biggest fleet stories are all about where the industry is headed next. Here's your Weekly Cheat Sheet.
Read More →
2027 Toyota Corolla Hatchback Adds Digital Displays, Technology Updates
Compact hatchback receives larger standard displays, new wheel and color options, and continues with a 169-hp four-cylinder engine.
Read More →

Teletrac Navman Begins Next Chapter as Standalone Private Company
What's new with Teletrac Navman and its new owner?
Read More →
Subaru Announces Pricing for 2027 Subaru Uncharted
Subaru has announced pricing for the 2027 Uncharted EV, which returns with no price increase, an estimated range of more than 300 miles, and a starting MSRP of $34,995.
Read More →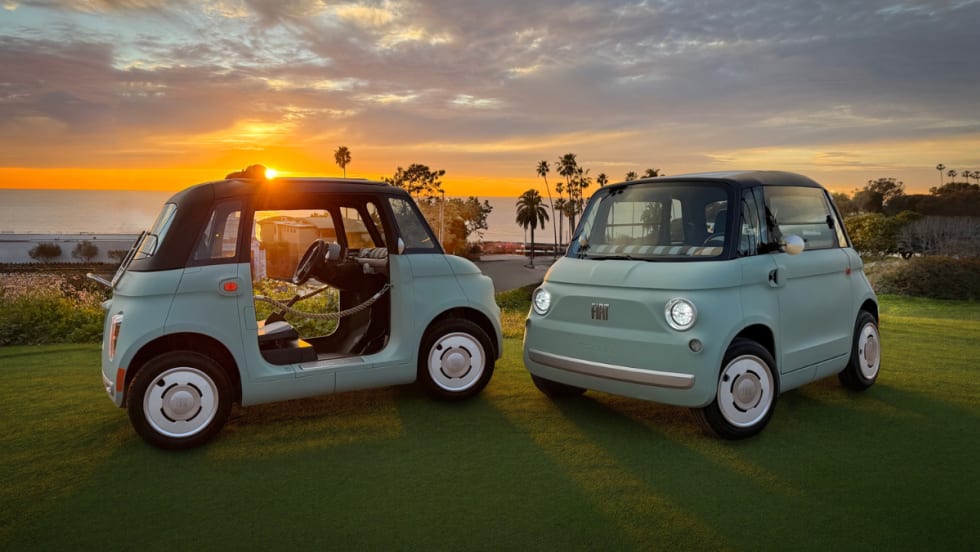
What Should We Make of the Fiat Topolino?
This atypical low-speed vehicle is coming to the U.S. It's smaller than a Smart Fortwo and starts at $13,995.
Read More →
USPS, Zipcar, DPD UK, and Others Named Winners of The Optimizers Awards 2026
USPS, Zipcar, DPD UK, and other fleet organizations were recognized in the 2026 Optimizers Awards for initiatives involving route optimization, automation, AI, and fleet utilization.
Read More →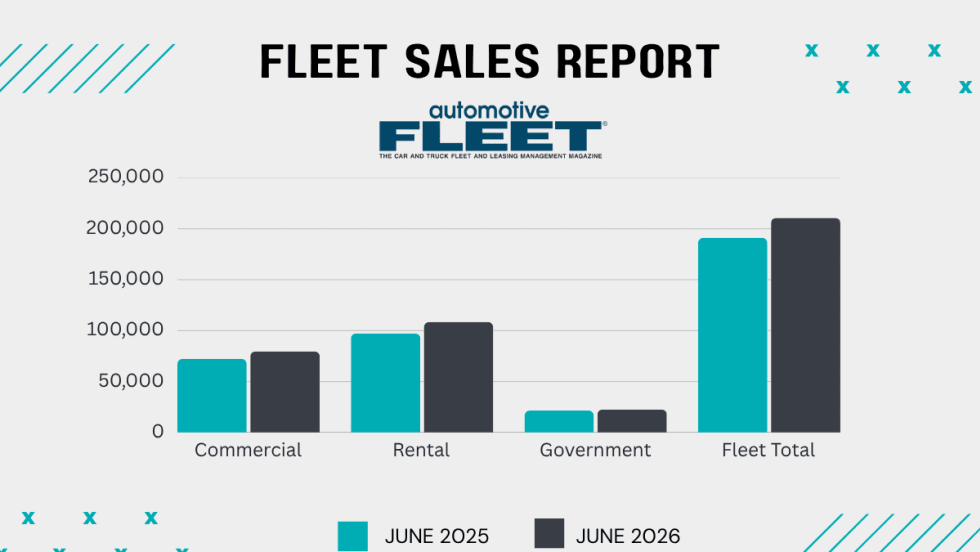
Commercial Fleet Sales Contribute To June, YTD Gains
The fleet sector has boosted its vehicle purchases at a reliable pace in the first half of this year compared with 1H 2025.
Read More →