

Fleet TCO Decreases Slightly in Q3
According to Vincentric, fleet cost per mile for most vehicle categories decreased slightly in the third quarter, while the Pickup and SUV categories remained the same.

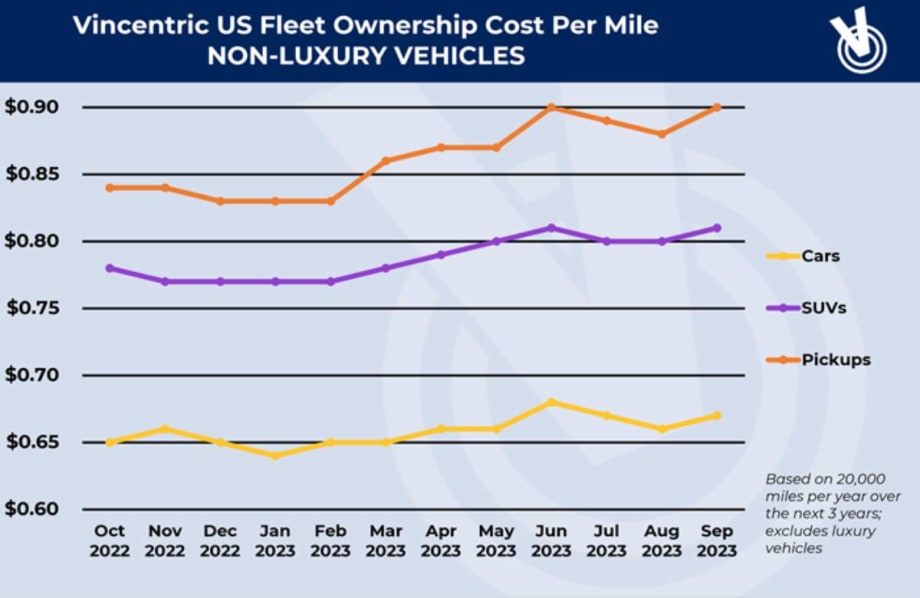
While ownership costs had been trending upward for the year, they dipped slightly in the third quarter. This may in part be due to the many MY24 vehicle models added to the Vincentric database, which contributes to cost factor fluctuations.
Credit: Vincentric LLC
Welcome to the latest installment of Fleet Data Depot, which provides snapshots of information, trends, and analysis relevant to the fleet market.
In this edition, the total cost of ownership experts at Vincentric deliver another quarterly update on per-mile ownership costs for fleets over the previous 12 months. These fleet cost-per-mile calculations are for the third quarter of 2023, July 1 to Sept. 30.
This analysis is based on vehicles driven 20,000 miles per year for a three-year window. As usual, Vincentric calculates its standard eight cost elements: depreciation, financing, fees and taxes, fuel, insurance, maintenance, opportunity cost, and repairs.
Cost Per Mile Decreases
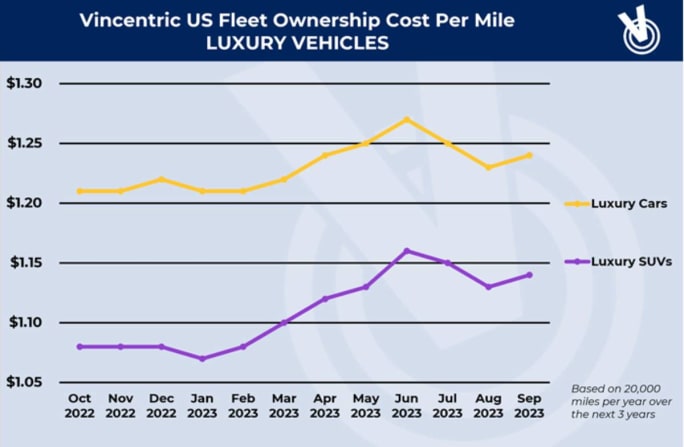
Ownership costs for luxury passenger cars and SUVs dipped in the third quarter after a steady rise throughout the year.
Credit: Vincentric LLC
Compared to last quarter’s analysis, fleet cost per mile for most vehicle categories decreased slightly in the third quarter, while the Pickups and SUVs categories remained the same:
Luxury Car: decreased by ~2.4%
Luxury SUVs: decreased by ~1.7%
Passenger Cars: decreased by ~1.5%
Pickups: 0% change
SUVs: 0% change
These decreases in cost per mile over the last quarter were primarily caused by substantial decreases in opportunity costs, Vincentric said. The opportunity costs for each vehicle category decreased by approximately 75% this quarter.
Vincentric reports that its data source for opportunity costs adjusted its methodology, which resulted in a significant decrease in savings interest rate since last quarter, which is likely the main cause for the decrease in overall opportunity costs.
Cost per mile can also be affected by the addition of new vehicle models introduced into Vincentric’s database from its data provider each month. Because these charts show the average cost per mile for overall categories such as Luxury SUVs, adding to the total number of vehicles in a category can also cause fluctuations in cost per mile on a month-to-month basis.
Since last quarter, Vincentric has begun adding a large number of MY24 vehicles, which contributes to cost factor fluctuations.
More Remarketing
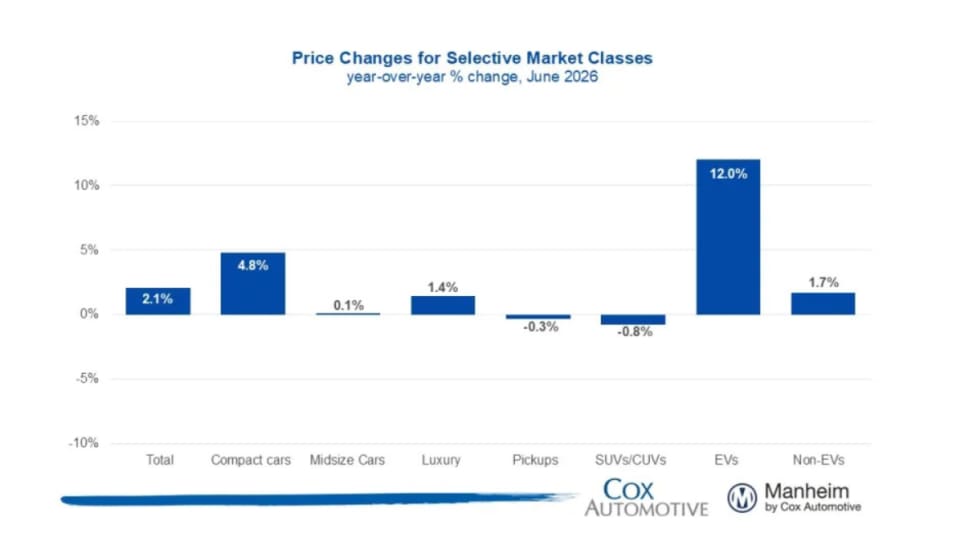
Manheim Index Shows Used-Vehicle Wholesale Prices Up 2.1% in June
The market is seeing stronger appreciation in older used vehicles this year, and the most affordable segments have been among the year’s best performers.
Read More →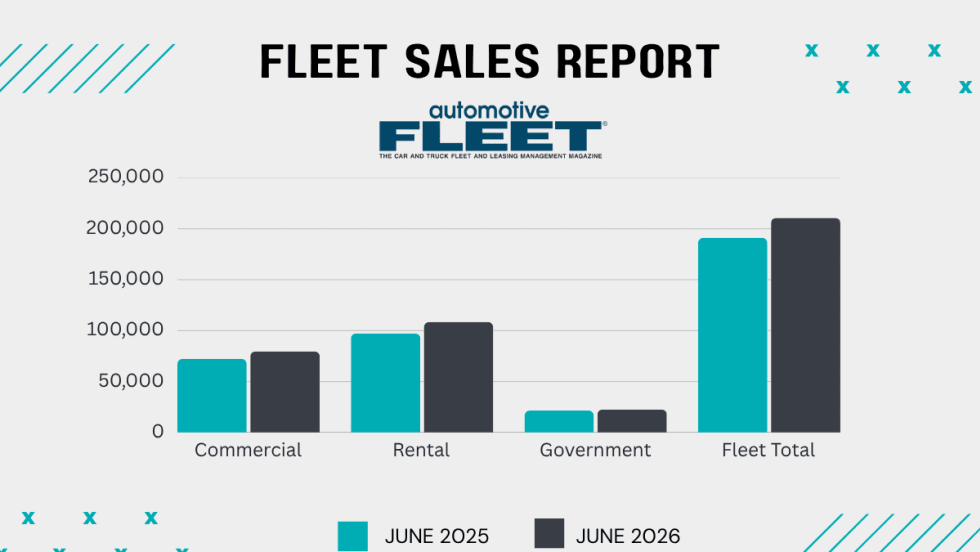
Commercial Fleet Sales Contribute To June, YTD Gains
The fleet sector has boosted its vehicle purchases at a reliable pace in the first half of this year compared with 1H 2025.
Read More →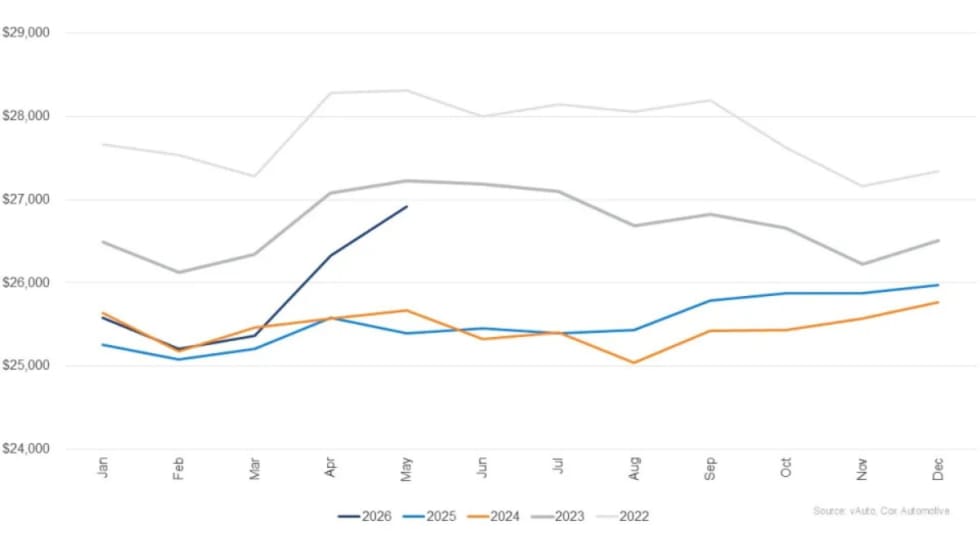
Used Vehicle Prices Climb Higher As Sales Pace Slows
The higher prices at used retail reflect strong wholesale values earlier in the spring, particularly for older, more affordable vehicles.
Read More →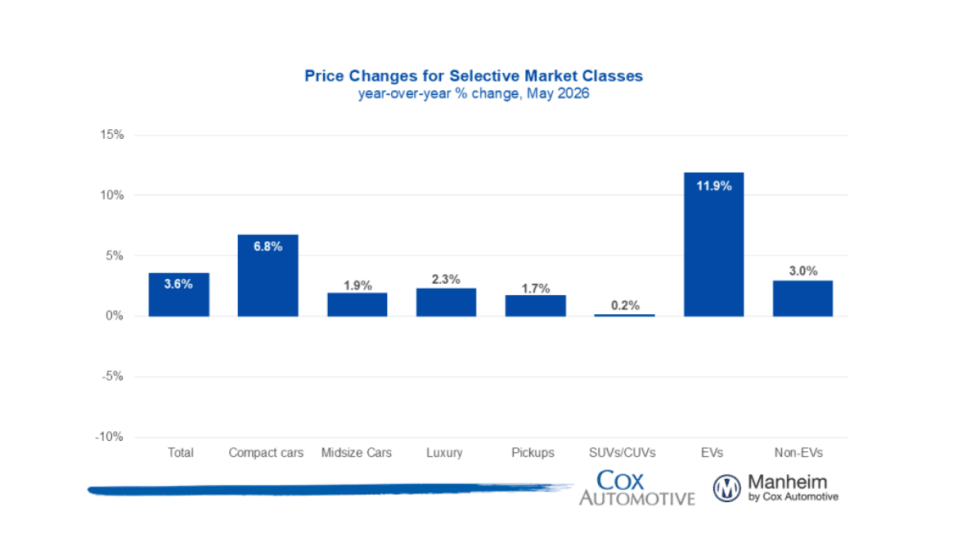
Wholesale Used Vehicle Market Sustains Moderate Rise In Values, Prices
Trends continue to normalize after a strong start to the year, as consumers contend with higher gas prices in the coming summer months.
Read More →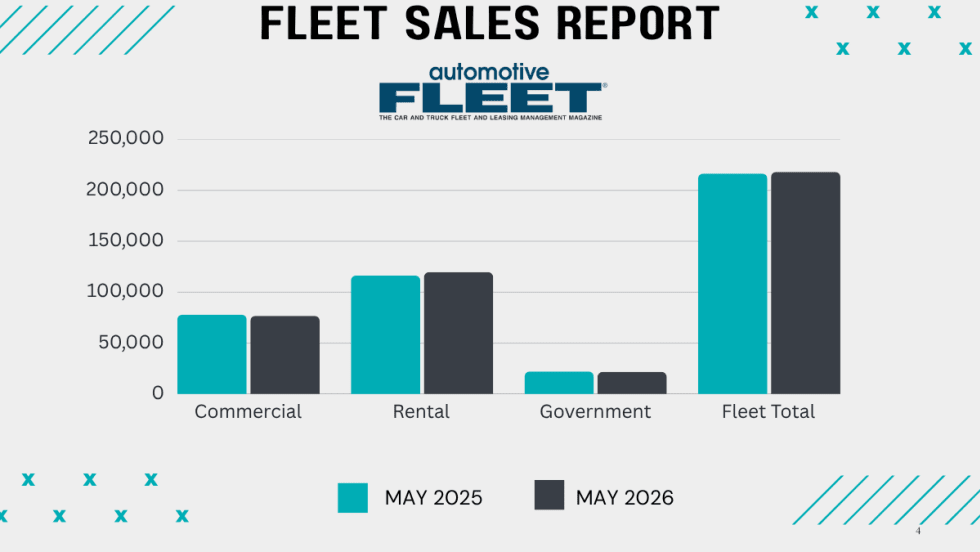
Commercial Fleet Sales Still Lead Sectors Despite May Mini Dip
The U.S. economy's continued growth and positive business investment are creating a favorable environment for fleet vehicle demand.
Read More →
How Connected Vehicle Data Is Lifting Fleet Resale Values
A vehicle health score could improve the value of fleet vehicles at remarketing. The path to a universal standard is forming, and fleets that understand the process early will be better positioned when it arrives.
Read More →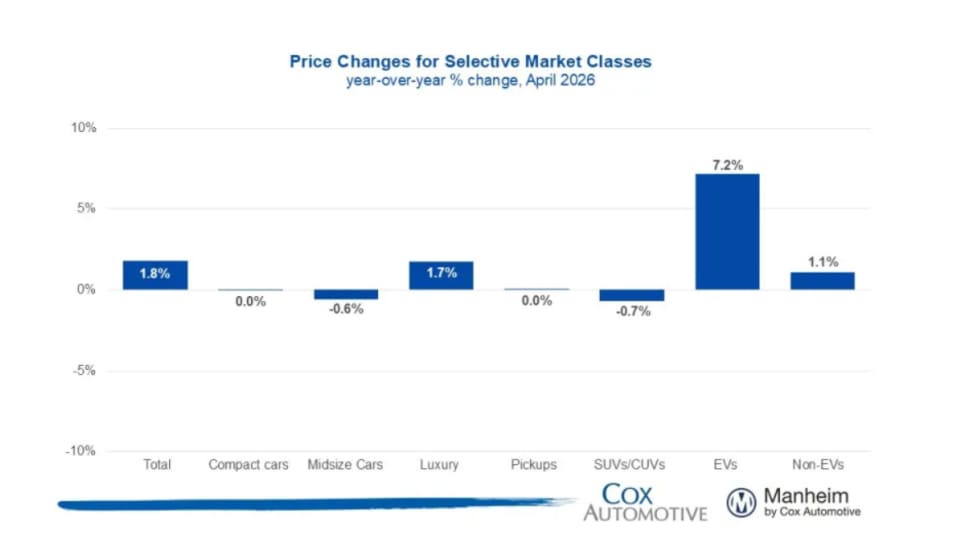
Wholesale Used Vehicle Prices Slightly Up In April
The Iranian conflict and rising gas prices inject much uncertainty into the future wholesale used vehicle markets, as higher gas prices soak up spendable income from vehicle buyers.
Read More →
CAR2026: James McKinley Wins Value Champion of the Year
James McKinley of City Rent a Truck was named the inaugural Fleet Value Champion at the CAR Conference for his data-driven approach to fleet lifecycle management and vehicle remarketing.
Read More →
CAR2026: Eric Autenrieth Wins Remarketer of the Year
Eric Autenrieth was recognized at this year's CAR Conference as the Remarketer of the Year.
Read More →
CAR2026: Lawrence Knapp Wins Consignor of the Year
Lawrence Knapp won the Cosigner of the Year award at this year's CAR Conference.
Read More →