

July 4 Remains Deadliest Driving Day
A new study concludes that Independence Day is the most dangerous day of the year to drive, with an average fatal crash rate of 14.9 per billion miles driven.
Source: Geotab
Source: Geotab
The Fourth of July is the most dangerous day to drive in the U.S., according to a new study from Geotab, and AAA forecasts that roughly 37.5 million Americans will take a road trip of at least 50 miles this weekend — up 2.9% from last year.
The National Safety Council said its calculations indicate 582 people may be killed on roads during this holiday weekend period, and an additional 66,900 may be seriously injured in crashes.
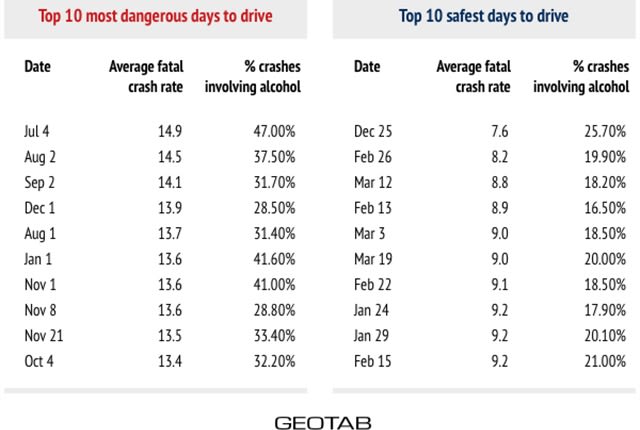
July 4 registers an average of 119 deadly crashes and a fatal crash rate of 14.9 per billion miles driven, research from Geotab found. Not surprisingly, July 4 has the highest percentage of fatal crashes involving alcohol or incidents of driving under the influence, with an average of 47%.
On average, 28% of all road crashes are related to alcohol and driving under the influence, but that rate rises significantly around national holidays. New Year’s Day (41.6%) and Halloween (41%), which also landed in Geotab’s top 10 list of most dangerous days to drive, have a high percentage of alcohol-related fatalities, too. Each recorded a fatal crash rate of 13.6.
Geotab’s study analyzed road fatality data over a 10-year period to determine national trends as well as how states in the country differ in road safety. Geotab is a telematics and GPS vehicle tracking company. Based on its findings, the company created an interactive map that indicates the most dangerous day to drive in each individual state. Click here to access the map.
Geotab researchers also found that July, August and September are the most dangerous months in which to drive, with each registering an average fatal crash rate of 12.
The top 10 most dangerous states for road deaths are Montana, South Carolina, West Virginia, Louisiana, Arkansas, Mississippi, Kentucky, Alabama, Tennessee and South Dakota, according to the study.
In its research, Geotab relied on road traffic, crash and fatality reports, including the Fatality Analysis Reporting System and Traffic Volume Trends — databases managed by agencies within the U.S. Department of Transportation.
Using this data, Geotab calculated a fatal crash rate for each day and U.S. state, made up of the total number of fatal road accidents per billion miles driven by cars, trucks and motorcycles.
Source: Geotab.
More Safety

Top 50 Executive Fleets
It is that time of year again! Time for the 2026 list of the Top 50 Executive Fleets, presented by Automotive Fleet and Volvo as part of its annual Fleet 500. Download now to see this year's list of companies!
Read More →
How Better Visibility Cut Speeding Violations by 48%
Fleet leaders don't need more data, they need clearer visibility into what the data is saying. This case study explores how one utility replaced speeding-event counts with a single metric — miles driven in violation — to strengthen safety and significantly reduce speeding violations.
Read More →
Operation Safe Driver Week: Why the Industry's Oldest Safety Campaign Still Matters to Fleets
A look at how a 2007 enforcement initiative became one of the most consequential weeks on the fleet safety calendar, and what it means for your drivers in 2026.
Read More →
Nexar-Nauto Merger Aims to Give Fleets Better Safety Intelligence Through Larger Driving Dataset
Stefan Heck tells Automotive Fleet that combining more than 10 billion miles of driving history with Nexar's AI models will give fleets deeper insights into driver risk and roadway conditions than either company could provide independently.
Read More →
From Silos to Solutions: Relationship Management for Safer Fleets
From telematics adoption and driver accountability to policy consistency and risk mitigation, this episode breaks down what it really takes to build a safer fleet culture without slowing business down.
Read More →
IIHS Launches First Commercial Vehicle Safety Evaluations
The Insurance Institute for Highway Safety has begun evaluating heavy-duty pickups and cargo vans for driver protection. Which models earned top marks?
Read More →
Reducing Risk by Eliminating Phone Use Behind the Wheel
Hosted with the cofounder of Lifesaver Mobile, this episode addresses phone use behind the wheel and how to design a driving environment that actually helps prevents accidents.
Read More →
Cameras, Safety and Insurance: From Reactive Claims to Real-Time Prevention (Part 2 of 2)
Part Two: Commercial auto remains one of the most challenging and costly lines of coverage for fleet operators and insurers alike. Continue learning more about how to effectively address these issues from Onur Aksan, Enterprise Business Development Executive, Geotab
Read More →
How 5-Second Telematics Data Is Changing Fleet Safety
This episode connects with Steve Santostasi of Ford Pro and covers how a few seconds of data can make a difference in fleet safety.
Read More →
The Two Biggest Summer Downtime Threats for Fleets
A conversation with a maintenance expert reveals the two most common summer maintenance pains and how to prevent them.
Read More →