

Fleet's Brave New World: Managing Fuel, Maintenance, and Telematics
Fuel costs, maintenance, and data management are top priorities as fleets look ahead.

At a Glance
While there are no crystal balls that fleet managers can use to predict the future, trends that they should be aware of include:
Continued fuel volatility and increased costs.
Changes in maintenance costs.
Proliferation of fleets adding telematics.
Today’s fleet management landscape does not provide a static, unchanging view. It is influenced by everything from the ups and downs of the economy to natural disasters such as last year's earthquake and tsunami in Japan to changing technology. And, while some trends may simply be interesting, others give a clear indication where the industry is and where it may be going. Recently, fleet management companies (FMCs) ARI - Automotive Resources International, Donlen, and PHH Arval analyzed fleet experiences specific to the three of the biggest trends facing the industry — fuel volatility, the adoption of telematics technology, and maintenance costs.
The results of their analyses not only give insight in areas the fleets are concerned about, but, in the case of fuel and maintenance, fleets need to work more efficiently to combat what will undoubtedly be a fleet expense that will do nothing but rise. As one possible aid, the use of telematics is increasingly becoming a pivotal tool in managing drivers and costs.
You can click the chart below to see a complete gallery of all the charts referred to in the article.
Fuel Costs Continue to Climb
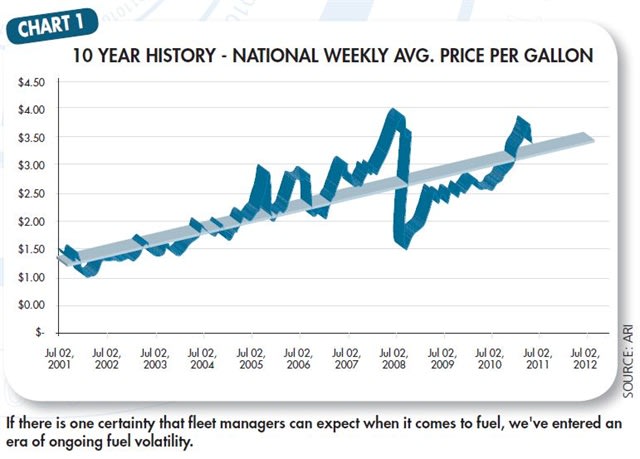
An ongoing trend for fleets and consumers alike is the continued volatility of fuel prices. ARI noted in its recent Industry Forecast 2012 that the Energy Information Administration (EIA) is predicating that the national average price per gallon (PPG) for the year will hover “around” $3.40 to $3.60. Diesel will clock in at about $3.90. The question, of course, is how long will these prices (which are down from 2011) hold fast? While there is no firm number that can be gleaned from the data, one thing is certain, ARI notes that “the days of consistent fuel prices are gone (for fleets).
The future of fuel is simple — an inevitable series of spikes and falls” (Chart 1). Not helping matters from a fleet operational cost perspective are new regulations, such as CAFE, which will put a premium on fuel-efficient models.
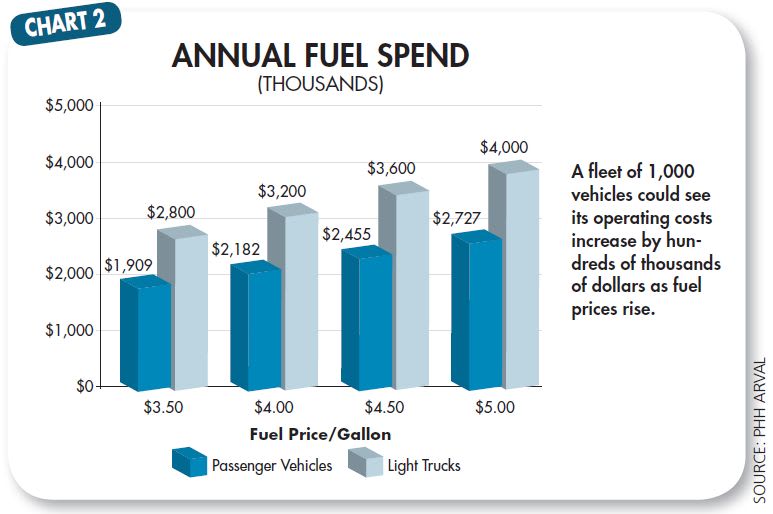
What volatile and often increased fuel prices mean for fleets is a higher cost of doing business. According to PHH Arval, an increase of just one dollar from $3.50 to $4.50 will increase the fuel expense of a fleet sedan by almost $550 per year (Chart 2). For light trucks, the increase is even tougher on a fleet budget — an even $800. If fuel increases just 50 cents more to $5, it will cost over $2,700 a year to tank up a passenger sedan and $4,000 for a light truck.
For a 1,000-unit fleet (500 passenger sedans and 500 light trucks), for example, a 50-cent increase at the pump can quickly add hundreds of thousands of dollars to annual fuel spend.
While these numbers should give fleet managers pause, PHH Arval emphasizes there are ways to overcome fuel price increases. Among them are eco-driving techniques: obeying the speed limit, keeping tires inflated, avoiding idling, maintaining the vehicle, removing excess equipment, and optimizing route planning.
Changes in Maintenance Costs
As vehicles age, they cost more to maintain. The top cost categories change throughout the life of the vehicle — for instance, tires and preventive maintenance are high-cost items for new vehicles (Chart 5), but by year five and beyond, the biggest category becomes engine maintenance with preventive maintenance now the lowest-spend category. While higher-cost transactions occur less frequently, they have a much higher cost per transaction.
However, some spend categories remain relatively flat after their initial increase. While brake and electrical costs are almost negligible in the first year of operation, by the third year of operation, they account for a combined 18 percent of spend per vehicle per year. This combined number stays relatively flat, and even edges down slightly during the vehicle’s “middle age.”
One of the consequences of fleets retaining their vehicles longer — often beyond replacement policy guidelines — is that many repairs fall outside of warranty coverage, adding to maintenance costs, according to PHH Arval.
Across vehicle classes and years in service, the top five categories of spend are tires, brakes, preventive maintenance, engine, and electrical.
The cost per transaction for the top categories has increased or remained relatively flat since 2010, with the exception of tires, which have seen a slight decrease through the first quarter of 2012 (Chart 3). This, as well as the number of transactions per vehicle decreasing, is a result of fleets beginning to replace older vehicles and trying to move back to policy guidelines. New vehicles means new tires, new brakes, and less maintenance transactions during the first year. In addition, the number of preventive maintenance transactions has decreased as more fleets have adopted elongated periods between oil changes.
The good news for fleets is that the average cost per vehicle transaction has fallen in each of the top five maintenance categories. For instance, preventive maintenance is only a third of the cost per vehicle in 2012 versus 2010. Brakes remain the highest spend category, but have fallen by almost $100 per vehicle (Chart 4).
Adoption of Telematics
Technology, in the form of telematics solutions, is the way many fleets are looking to manage their operations more efficiently. In fact, telematics/GPS is the most widely used management technology (Chart 8). This is followed in descending order by other types of monitoring devices, advanced analytics, mobile device applications, and automated solutions for regulatory compliance. While routing — with an eye to controlling fuel spend — is among the top reasons fleet managers are turning to telematics solutions, a slightly bigger priority is improving driver behavior (Chart 11). No matter what the particular goal for telematics adoption, the overall goal is to increase operational efficiency across the board (Chart 7).
Fleets of 300 or more surveyed outnumber smaller fleets in the adoption of telematics solutions (Chart 10). In its survey of telematics use, Donlen found that, for those not using telematics, no business need was listed by the majority (69 percent) of the respondents. However, cost was not a factor for only 17 percent of the respondents. According to Donlen's summary of its findings, the most frequent “other” response was that telematics was not being discussed in the given organization as a possible operational management solution. This coincides with a telling finding that of fleets of less than 100 vehicles, an overwhelming 80 percent are not considering telematics and only 15.7 percent who aren’t current users are considering telematics.
However, for fleets of 300 vehicles or more, telematics are being used by nearly one third of the fleets surveyed with only 20 percent not considering using them. While fuel savings was ranked as the No. 2 reason for fleets considering telematics, those who had implemented a telematics solution listed fuel savings as the third most important reason for using telematics. In both the using and the considering categories, monitoring driver behavior was the No. 1 reason to use telematics.
Likewise, ARI’s recent telematics survey found that improving fleet efficiency, not cost savings, was the overwhelming reason to implement a telematics solution (Chart 9).
Of course, in today’s budget-conscious environment, it is difficult to ignore the bottom line for very long. While the stated motivation to implement a telematics solution may not be wholly to save money, those that do see a better return on investment (ROI) today than just four years ago (Chart 6).
According to a PHH Arval study on the increasing ROI of telematics solutions, hardware costs were between $250 and $300 less in 2011 than they were in 2008. At the same time, the telematics quality has steadily increased — rated at just five on a 1-10 scale (with 10 being best) in 2008 to nine in 2011. While the cost of telematics have decreased over the last four years, the return on investment has increased from $80-$150 per month per unit in 2008 to $185-$255 per month per unit in 2011.
In the Donlen survey, ROI was an important consideration in deciding whether to use a telematics solution. However, 46 percent of its survey group considering telematics reported they couldn’t calculate the ROI. Likewise, of those who had adopted a telematics solution, 40 percent didn’t know their ROI.
ROI is important for today’s fleet manager, but having an effective fleet that helps to fulfill the company mission and serve its customers may be of even greater importance.
On this count, telematics are playing a key role in improving fleet processes. According to the ARI telematics survey, the overwhelming majority of fleet managers (59 percent) said that telematics would make “most” of their fleets’ processes more efficient; with a little less than one-third said that telematics would improve about “half” of the fleet processes. Surprisingly, 2 percent of fleet managers believe that telematics would be of no benefit to their fleet.
The Bottom Line
The bottom line is the bottom line. While there are expenses that are out of the hands of fleet managers, as the statistics show, there are always ways to combat rising costs, either through driver behavior, e.g., eco-driving, or through technological innovations, e.g., telematics.
If there is one trend that continues to carry through the fleet industry, it is the willingness to adapt to an ever-changing world.
More Fuel
July Fuel Update: Prices Jump for the First Time in Two Months
As the U.S.-Iran ceasefire collapses, so do the gas prices.
Read More →
Bob Adamsky on Fuel Volatility: "Don't Panic, Have a Plan."
When it comes to up and down fuel prices, Adamsky has a message for fleets: “Don’t panic.”
Read More →
How Fleets Can Gain Control of Non-Fuel Spend
Fuel often gets the spotlight, but non-fuel expenses can have a major impact on fleet costs. Ramel Lindsay of U.S. Bank Voyager discusses how fleets can gain better visibility and control over these often-overlooked expenditures.
Read More →
Fuel is Just the Start: How Middle East Tensions are Driving Up Fleet Maintenance Costs
The Middle East conflict is doing more than pushing up fuel prices. It’s also raising the cost of key maintenance products your fleet depends on, from motor oil to tires to windshield wipers. Here’s what you need to know about this budget-busting situation.
Read More →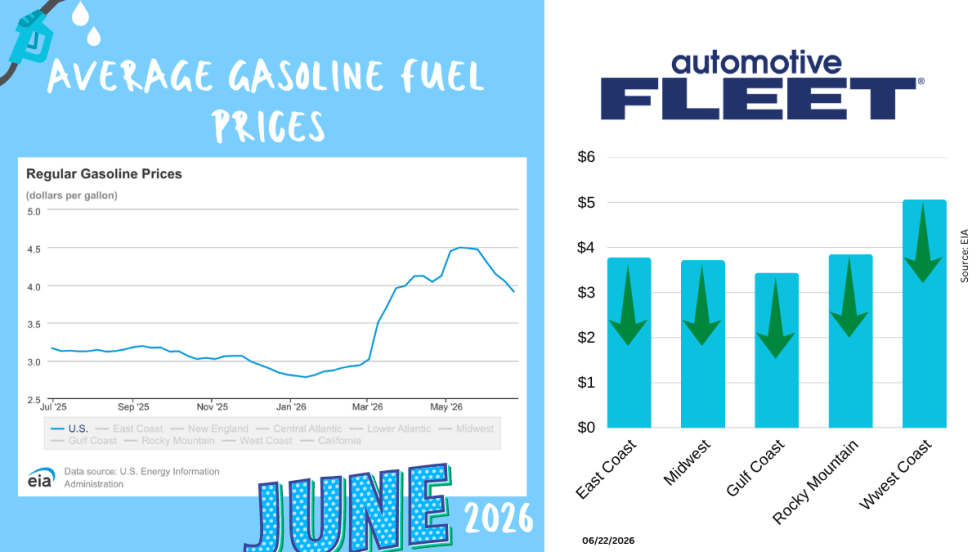
June Fuel Update: Prices Fall Below $4
Drivers are finally getting some relief at the pump. The national average gas price has dropped below $4 a gallon for the first time in months, with prices falling in 47 states as oil markets react to developments in U.S.-Iran negotiations.
Read More →
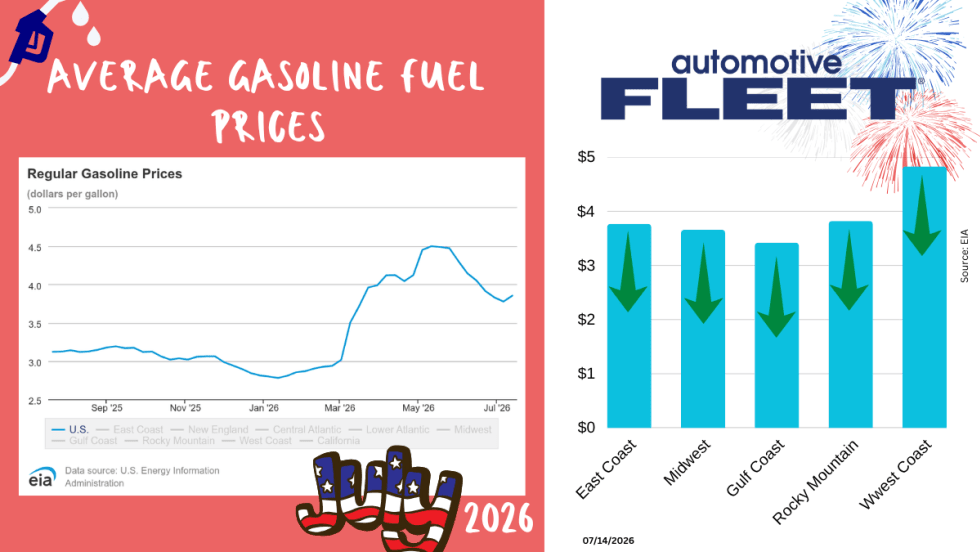
Study: How 2026's Gas Price Hikes Affect Different Vehicle Types
New data from iSeeCars reveals how rising fuel costs have affected different vehicle segments as gasoline prices climbed nearly 46% over the past four months.
Read More →Are You Tracking Your Fleet's True Total Cost of Ownership?
Bobit Business Media surveyed 190 fleet professionals and found that while most fleets are tracking costs, fragmented systems and data gaps are keeping true TCO visibility out of reach. With rising pressure to control spend in an increasingly volatile environment, the gap between what fleets think they know and what the data actually shows is wider than you might expect. See how your peers are managing costs today and where the industry still has room to improve.
Read More →
May Fuel Update: All Regions Experience Declines
Gas prices are finally easing in much of the country, but experts warn global tensions could quickly reverse the trend as the national average remains well above last month’s levels.
Read More →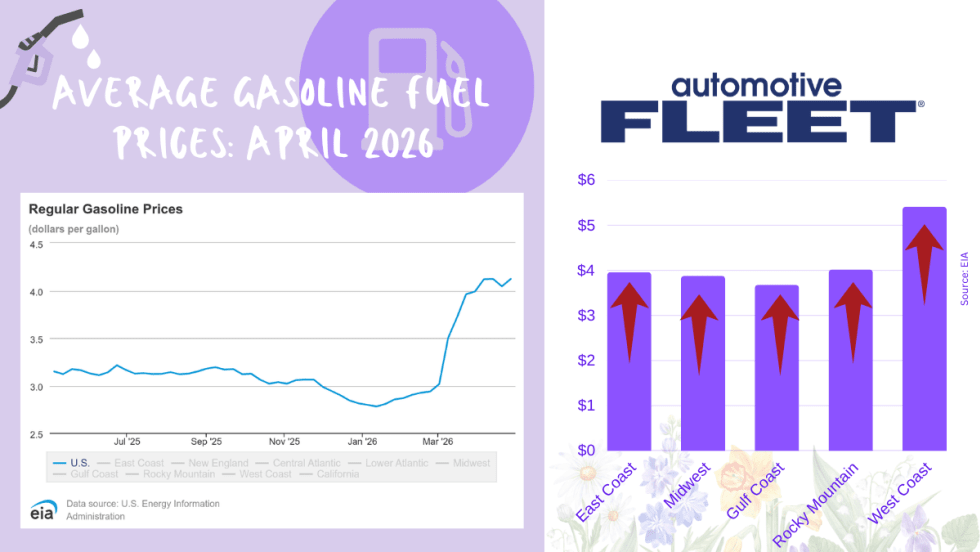
April Fuel Update: Prices Climb Above $4 as Spring Surge Accelerates
National average jumps to $4.04 per gallon, up sharply from last year, with West Coast prices topping $5 and further increases expected amid rising oil tensions.
Read More →
Tips from Fleet Managers on Saving Fuel Costs
Fleet leaders share practical strategies to reduce fuel spend through smarter policy, routing, and driver guidance.
Read More →