

Rising Oil Prices and Speculation Driving Recent Rapid Increase in Fuel Prices
WASHINGTON – Oil and gasoline prices have risen dramatically during the last month, with a mix of geopolitical pressures and speculation as the primary factors, based on information from AAA and the U.S. Energy Information Administration.
WASHINGTON – Oil and gasoline prices have risen dramatically during the last month, with a mix of geopolitical pressures and speculation as the primary factors, based on information from AAA and the U.S. Energy Information Administration (EIA).
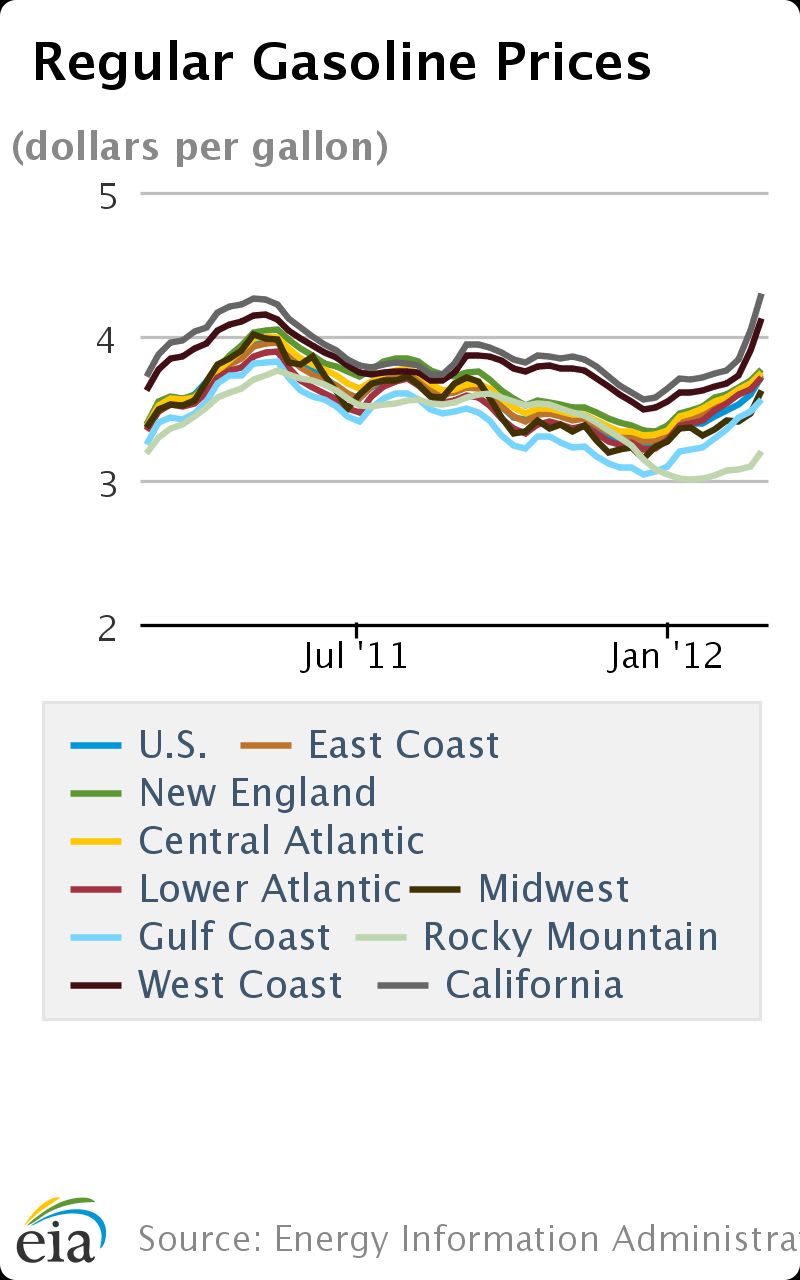
According to a new report from AAA, earlier this week retail gas prices had increased for 32 consecutive days. On Jan. 26, 2012, the national average was $3.38. On Feb. 28, the national average was $3.70. This is 35 cents higher than during the same period in 2011, AAA stated. You can see in the included chart (shown below) from the EIA how prices have changed over the last few months.
On-highway diesel prices aren't faring much better, with the average price at $3.72 on Feb. 27, up from $3.52 on Feb. 13, according to the EIA. This price is 33 cents higher than the same period last year.
What’s unusual about these price increases is that they’re happening in a market with low demand for gasoline. Despite higher consumer confidence and a strengthening dollar, the recently released EIA figure of 8.628 million barrels of gasoline consumed per day (for the week of Feb. 27) is still 500,000 lower than the consumption level for the same period in 2011. In addition, the four-week average is more than a 6-percent year-over-year decline in U.S. demand for gasoline.

As these gasoline prices have risen, some parts of the U.S. have been much more insulated from the increases than others. To compare, AAA said retail gasoline prices in three states now exceed $4 per gallon on average, with Hawaii at $4.32, California at $4.29, and Alaska at $4.09. On the other side of the spectrum, Wyoming and Colorado are paying less than $3.20 per gallon, at $3.12 and $3.14, respectively. Pacific Coast states have seen an increase of more than 54 cents, while the price in the Mountain states has only increased by 16 cents.
One major reason for the regional spread between prices is due to the types of crude oil purchased by U.S. refiners on a regional basis, for example Brent crude or Louisiana Light Sweet (LLS) rather than the usual crude oil type used as a benchmark, West Texas Intermediate (WTI). Refiners in the central U.S. purchase cheaper types of crude and therefore are able to pass those savings on locally, whereas coastal refiners are purchasing other, more expensive types of crude oil.
For example, a recent EIA report showed that the New York Mercantile Exchange (NYMEX) light sweet crude oil contract (WTI) rose from $99.77 per barrel to $107.66 per barrel between Dec. 30, 2011, and Feb. 27, 2012. However, the price of Brent crude, which EIA said is more representative of global prices for light sweet crude oil, rose from $108.04 per barrel to $123.56 per barrel over the same period.
What’s contributing to the rapid rise in oil prices? Unsurprisingly, geopolitical tensions in the Middle East (Iran and Syria) are contributing to speculation, plus production drops in South Sudan, Syria, Yemen, and the North Sea, which have caused supply interruptions during the last two months.
AAA says speculation is also a major factor, with prices being driven higher by a possible future oil supply impact rather than a current shortage. The organization cited the Commodity Futures Trading Commission’s (CFTC) figures, which showed that the number of “reformulated blendstock for oxygenate blending” (a.k.a. RBOB) gasoline futures contracts were at 56,686 in March, 2011, but by comparison at an all-time high of 88,204 during late February, 2012.
RBOB contract prices, according to the EIA, do not include motor fuel taxes, or any costs or profits from distributing and retailing gasoline. EIA said the contract price for RBOB, which calls for delivery of this type of gasoline blendstock at the New York Harbor, rose from $2.68 to $3.11 between Dec. 30, 2011, and Feb. 27, 2012. The organization also said RBOB price increases are typically reflected in retail gasoline price increases.
Lastly, the EIA said that although it estimates spare crude oil production capacity is higher now than between 2003 – 2008, when measured as a percentage of global oil production, the actual level is “quite modest” when compared with historical production standards. This is adding pressure to current speculation in the marketplace, especially in light of the geopolitical concerns in the Middle East.
By Greg Basich
More Fuel

Turning Fleet Payment Data into Executive Insights
Ramel Lindsay of U.S. Bank Voyager discusses how fleets can transform payment and transaction data into actionable intelligence to reduce costs, improve oversight, and support executive decision-making.
Read More →
Why the IRS Raised Its Mileage Rate in the Middle of 2026
Fuel-price volatility drove the rare increase to 76 cents per mile, the fifth midyear adjustment since 2000.
Read More →
July Fuel Update: Prices Keep Rising in Light of More Conflict
Gas prices continue to rise as more and more conflicts do, too.
Read More →
Bob Adamsky on Fuel Volatility: "Don't Panic, Have a Plan."
When it comes to up and down fuel prices, Adamsky has a message for fleets: “Don’t panic.”
Read More →
How Fleets Can Gain Control of Non-Fuel Spend
Fuel often gets the spotlight, but non-fuel expenses can have a major impact on fleet costs. Ramel Lindsay of U.S. Bank Voyager discusses how fleets can gain better visibility and control over these often-overlooked expenditures.
Read More →
Fuel is Just the Start: How Middle East Tensions are Driving Up Fleet Maintenance Costs
The Middle East conflict is doing more than pushing up fuel prices. It’s also raising the cost of key maintenance products your fleet depends on, from motor oil to tires to windshield wipers. Here’s what you need to know about this budget-busting situation.
Read More →
June Fuel Update: Prices Fall Below $4
Drivers are finally getting some relief at the pump. The national average gas price has dropped below $4 a gallon for the first time in months, with prices falling in 47 states as oil markets react to developments in U.S.-Iran negotiations.
Read More →
Study: How 2026's Gas Price Hikes Affect Different Vehicle Types
New data from iSeeCars reveals how rising fuel costs have affected different vehicle segments as gasoline prices climbed nearly 46% over the past four months.
Read More →Are You Tracking Your Fleet's True Total Cost of Ownership?
Bobit Business Media surveyed 190 fleet professionals and found that while most fleets are tracking costs, fragmented systems and data gaps are keeping true TCO visibility out of reach. With rising pressure to control spend in an increasingly volatile environment, the gap between what fleets think they know and what the data actually shows is wider than you might expect. See how your peers are managing costs today and where the industry still has room to improve.
Read More →
May Fuel Update: All Regions Experience Declines
Gas prices are finally easing in much of the country, but experts warn global tensions could quickly reverse the trend as the national average remains well above last month’s levels.
Read More →