

Fleet Driver Report Says North American Drivers Safer Than U.K. Drivers
REDWOOD CITY, CA -- The study, based on the behavior of 85,000 fleet drivers across North America and the U.K., shows the GreenRoad worldwide average safety score improved by 24% in 2011. In North America, speeding was the most common risky behavior.
The GreenRoad data is based on the safety scores automatically calculated through the use of sophisticated in-vehicle technology that captures and tabulates risky or fuel-inefficient driving events.
REDWOOD CITY, CA – GreenRoad, a leader in driver performance and safety management, has released its first annual GreenRoad Worldwide Fleet Driver Performance Benchmark Report. The report aggregates 2011 data representing actual driving behavior of 85,000 fleet drivers logging over 127 million trips and 7.4 billion miles across North America and the United Kingdom.
Overall, in 2011 the GreenRoad worldwide average safety score improved by 24%, and North American fleet drivers tended to be safer than their U.K. counterparts. In North America, speeding was the most dominant unsafe driving behavior. But in the U.K., harsh braking was the most common risky behavior.
The report also shows that in the U.K., December was the safest fleet driving month and January was the riskiest. In North America, average safety scores didn’t vary widely from month to month.
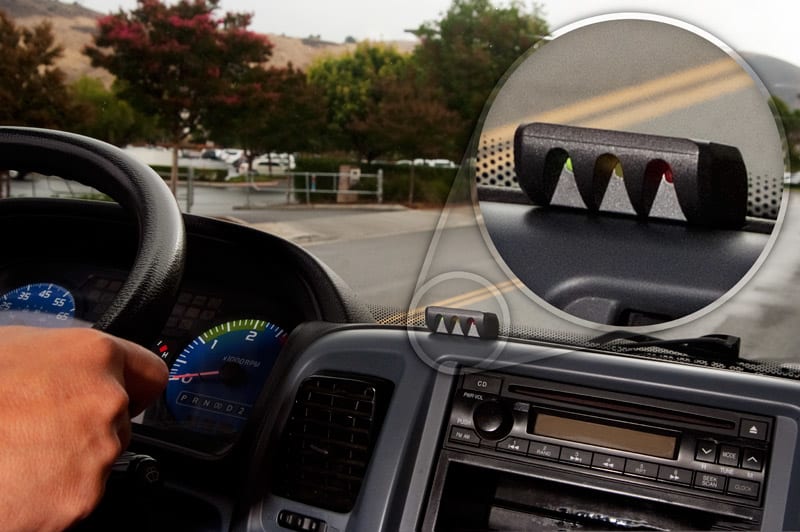
The GreenRoad data is based on the safety scores automatically calculated through the use of sophisticated in-vehicle technology that captures and tabulates risky or fuel-inefficient driving events. The lower the safety score, the safer the driver. Driving was measured across five major categories: braking, acceleration, corner handling, lane handling and speeding.
"Through this data we begin to more clearly understand the factors impacting fleet safety," said Jim Heeger, chief executive of GreenRoad. "This is critical to reach the goal that we all share: delivering the best drivers on the road -- safe, fuel-efficient and green. We have a rich store of behavior-based data for reducing insurance and crash costs which will only get bigger and more valuable over time."
In 2011, the GreenRoad worldwide average safety score dropped to 22 versus 29 -- a 24% drop. The safety score averages were calculated across those drivers who had more than 500 driving hours with GreenRoad in 2011.
The 2011 GreenRoad benchmark data shows important geographic differences between North American and U.K. safety scores. In North America, speeding was the most dominant safety event, making up 40% of the average safety score’s risky maneuvers. Sharp cornering was next at 26%, with harsh braking following at 16%, lane handling 10% and rapid acceleration at 8%.
In the U.K., harsh braking was the most common risky behavior at 43%, followed by sharp cornering at 39%, land handling and acceleration at 8% each, and speeding at 2% of the safety score composition.
"U.K. fleet routes are largely urban environments with extensive roundabouts and other road features that require precise cornering ability," Heeger explained. "On the other hand, North American fleets tend to drive in a more mixed environment of urban, suburban and rural environments with more freeway and highway driving. Thus, you see the tendency for fleet drivers to speed in the U.S."
According to the data, 11 p.m. to 1 a.m. was the riskiest driving time in North America. In the U.K., 11 p.m. to midnight was the riskiest.
The first annual GreenRoad Worldwide Fleet Driver Performance Benchmark Report is based on analysis of GreenRoad proprietary data. The GreenRoad Safety Score for 2011 versus 2010 compares those drivers who logged more than 500 driving hours with GreenRoad. The driver safety score analysis demonstrates how GreenRoad impacts driver Safety Scores over time. The sample included 1,000 drivers who have accumulated the most driving hours on the GreenRoad service from companies with fleets that represent the general market.

The GreenRoad data is based on the safety scores automatically calculated through the use of sophisticated in-vehicle technology that captures and tabulates risky or fuel-inefficient driving events.
For the full report, click here.
For more information about GreenRoad and its services, click here.
More Safety

Nominations Open for 2026 Fleet Safety Award
Nominations have officially opened for the 2026 Fleet Safety Award Winner.
Read More →
Turning Connected Vehicle Data Into Decisions That Matter
Fleet leaders have more data than ever, but turning that data into clear, actionable decisions remains a challenge. This white paper shows how leading organizations are using connected vehicle data to improve safety, reduce costs, and optimize fleet performance. Learn how to turn insight into action across your fleet.
Read More →
Cameras, Safety and Insurance: From Reactive Claims to Real-time Prevention
Commercial auto remains one of the most challenging and costly lines of coverage for fleet operators and insurers alike. Learn more about how to effectively address these issues from Onur Aksan, Enterprise Business Development Executive, Geotab.
Read More →

NAFA Fleet Safety Symposium to Collocate With 2026 Fleet Forward Conference
The daylong certificate program will precede the Fleet Forward Conference at the Gaylord National Harbor in Maryland.
Read More →
The Distractions You Can’t Turn Off: What Drivers Face Outside the Vehicle
Fleet drivers face constant visual, cognitive, and environmental interruptions the moment they hit the road. From roadside chaos to mental fatigue and digital overload, today’s biggest driving risks often come from outside the vehicle itself.
Read More →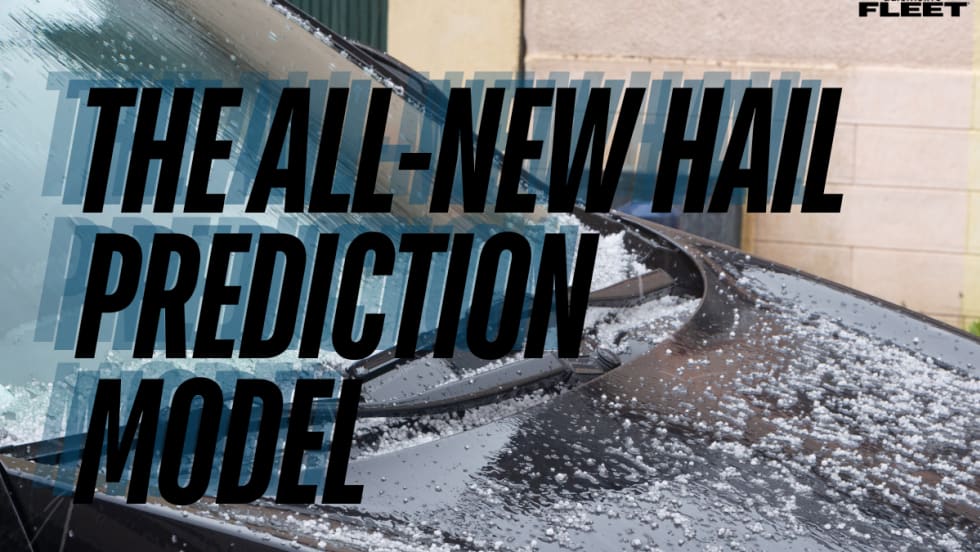
FLASH Weather AI Launches First Deep-Learning Hail Prediction Model With High-Resolution Forecasting
FLASH Weather AI has launched a first-of-its-kind hail prediction model capable of forecasting hail size and arrival time at 1-kilometer resolution up to 55 minutes ahead, giving fleets and insurers critical time to prepare for severe storms.
Read More →
How Coca-Cola United Protects Its Fleet from Growing Legal Risk
As litigation risk rises, vehicles are increasingly targeted. This Coca-Cola bottler shares how it’s reducing exposure through driver training, technology, and a proactive risk management approach.
Read More →
How to Speak the Same Language on Fleet Safety
Drivers, supervisors, and data often speak different safety “languages.” Getting on the same page will drive better results.
Read More →
Fleet Cybersecurity 101: What You Need from Your Technology Vendors
From identity management to third-party certifications, the right technology partner should make security easier to manage. Here are the three building blocks that fleet managers need to stay in control as connected systems scale.
Read More →
Reducing Risk by Eliminating Phone Use Behind the Wheel
Distracted driving remains one of the most persistent risks in fleet operations. New approaches focus on removing mobile device use entirely while adding real-time safety support.
Read More →