

Pros & Cons of Extending Replacement Policy
It has been “common wisdom” to replace fleet vehicles in relatively short cycles. Rising costs, however, have led fleet managers to consider lengthening replacement criteria. There are pros and cons to the practice.
Replacement policy is one of the most critical aspects of fleet management. Nearly every other cost, both fixed and variable, hinges upon when vehicles are replaced. Maintenance and repair expense, fuel efficiency, and of course, depreciation are all sensitive to replacement policy.
The most commonly accepted cycle, for many years, has revolved around time/mileage combinations of 36 months and 65,000 miles for autos; approximately 48 months and 75,000-100,000 miles for light trucks. While this cycle reflects a certain logic, the many changes in vehicles, warranties, and financial considerations have led some fleets to consider lengthening replacement policy.
For years, the logic in replacement policy has been that vehicles kept beyond three years or 65,000 miles risk major component failure, as well as a drop in residual value, the combination of which causes total lifecycle costs to rise. Replace too soon, and depreciation will be too high; replace too late, and both mechanical failure risk as well as overall variable expense will spike.
That logic held much truth. Years ago when this “common wisdom” was
established, new-vehicle warranties were 12 months and 12,000 miles, and vehicle quality was mediocre. Keeping vehicles in service too long, beyond the 36-month cycle, did indeed risk engine and drivetrain failures, and rising depreciation as well.
Variable expense tends to ratchet upward. For the first 35,000-45,000 miles, variable expense is generally limited to preventive maintenance: oil changes, wheel alignments, tire rotation, etc. The two largest (nonfuel) predictable variable expense events are tire and brake replacement, which generally occur sometime after 30,000 miles.
At this point, variable expense, measured in cents per mile (CPM) spikes upward as tires and/or brakes are replaced. As mileage further accumulates, CPM begins to decline, but not back to the previous level. This “ratchet” effect generally continues throughout the life of the vehicle.
On the fixed-cost side, comprising primarily depreciation, the curve in CPM is dramatically different. Depreciation cost begins high, as the vehicle is titled and driven off the lot. As mileage accumulates, the depreciation expense curve declines steeply; the vehicle continues to depreciate at a relatively slow rate for the balance of its in-service life.
In fleet usage, mileage is accumulated at a rate approximately twice that of the typical personal vehicle. For that reason, previous logic determined even a well-maintained vehicle suffers increased risk of major mechanical failure as time in service and mileage accumulate.
Relating depreciation cost trends to the variable expense narrative, then, with mileage accumulating quickly, the best time to replace fleet vehicles is after the first incidence of tire/brake replacement, but before the next one, i.e., somewhere in the 65,000-75,000 mile range.
Figure 1 details CPM costs at 5,000-mile intervals. The trend can clearly be seen. The variable CPM is relatively nominal until the 30,000-mile increment, then spikes high at 40,000 miles with the replacement of tires and brakes, declines slowly again until the second round of tires and brakes hits at 80,000 miles.
Using these assumptions, the most cost-efficient time to replace, based upon variable cost, is between 70,000 and 75,000 miles. Naturally, actual maintenance and repair expense is not quite so cooperative as to fall in neat, predictable increments; tires go flat, hoses and belts breach, windshields need replacement. A replacement policy cannot predict such events when initially established. As the fleet ages, actual expense history can be blended into, and ultimately replace, the assumptions. The trend, however, is not likely to differ greatly.
[PAGEBREAK]
Depreciation expense is even more difficult to predict. Depreciation is ultimately determined by the difference between the original cost of the vehicle and its resale proceeds. Resale markets are notoriously sensitive to several influences, such as season, weather, the number of similar vehicles on the market, fuel prices, and many other circumstances.
Taking a currently popular, fleet- equipped, four-door mid-sized sedan,
brought into service Oct. 1, 2007, with 16,000 miles, depreciation CPM is:
Original cost: $21,300
Wholesale value: $14,200
Depreciation: $7,100
CPM: 0.4438
A stunning result, but relatively accurate in the depiction of depreciation costs when a fleet vehicle, accumulating 2,000 miles per month, is sold prematurely.
Unlike variable costs, however, it is nearly impossible to project residual values in the volatile used-vehicle market, particularly for higher-mileage fleet vehicles. To illustrate how the depreciation curve differs from that of variable cost, consider the same vehicle, a 2007 sedan brought into service Oct. 1, 2007, with 40,000 miles:
Original cost: $19,780
Wholesale value: $8,900
Depreciation: $10,880
CPM: 0.2720
One additional year in service knocks the depreciation CPM down by nearly 42 percent. The depreciation curve effect and how it differs from that of maintenance and repair expense is evident, despite the difficulty of making such assumptions, and it will continue for the balance of the vehicle’s in-service time. Further, adding variable cost projections to the calculations, the combination of the two declines over time:
At eight months in service, with 16,000 miles, the total cost is 0.4511 cents per mile.
At 20 months in service, with 40,000 miles accumulated on the odometer, the total cost is 0.2984 cents per mile.
Since depreciation is the largest portion of total lifecycle costs that vary over time and with the accumulation of mileage, it would appear even as maintenance and repair expense ratchet upwards, the longer a vehicle is kept in service, the lower lifecycle costs are. (Certainly, today’s fuel prices have boosted fuel costs to equal or exceed depreciation; however, theoretically, fuel costs do not vary with time and mileage.)
Using reasonable assumptions and some real-world numbers, we’ve seen that in the first two years of service, holding costs decline as mileage is accumulated. What, then, might happen if vehicle service life is extended beyond the 70,000 plus-or-minus miles that seems to be the most cost-efficient time?
To do so, service life would have to be extended beyond 80,000 miles. At that point, the next tire/brake event occurs, variable cost spikes once again to its highest point yet, and replacing the vehicle at that time locks in that higher cost. Meanwhile, the depreciation curve continues to level off.

Again, using the same maintenance and repair projections, at 95,000 miles (just short of four years in service), the variable CPM is 0.0243 cents per mile. (The “ratchet” effect is evident; it is lower than at 80,000, but not back down to the previous low of 0.0199 CPM at 75,000 miles.)
The difference between the residual value at 75,000 miles and at 95,000 miles is not nearly as much as that between 16,000 and 40,000 miles, i.e., the leveling off of the depreciation curve. The simplest explanation for this phenomenon is that a vehicle is never worth “zero.” As long as the vehicle is running and has no major physical damage, it will always command some resale price. Even with serious issues, it will always have salvage value.
Logically, it seems as though with the depreciation curve leveling and maintenance/repair costs a much smaller part of overall lifecycle costs, an extended vehicle lifecycle is a reasonable change. Recalling “common wisdom,” however, as vehicle mileage accumulates beyond the 75,000-mile mark, the risk of major mechanical component failure becomes a factor in the decision.
It cannot be assumed, for example, a transaxle or engine will fail. However, once it happens, all the formulae described previously go out the window, and the fleet manager is stuck with thousands of dollars in unanticipated cost and the possibility of a mechanical total loss.
There is the additional effect of the 100,000-miles “milestone,” when the psychological effect of the odometer turning over can have a seriously negative effect on residual value at wholesale or auction.
Some would say there is little reason not to keep a vehicle in service beyond that century mark. If an engine is “bad,” most likely it will fail long before that 100,000-mile increment. Additionally, today’s vehicles carry powertrain warranties that extend to that level (assuming, of course, the vehicle has been properly maintained).
Combining this longevity factor with the ever-leveling depreciation curve, vehicles might become cost-efficient well beyond normal, or even extended, replacement cycle parameters. Finally, add the fact that the effect of increasing vehicle prices and assumption of a new, higher lease rate are avoided.
[PAGEBREAK]
What, then, is the downside of extending vehicle service life? It is difficult to spell out on paper, but as vehicles remain in service, overall condition begins to deteriorate:
Internal seat, carpeting, and roof liner wear and tear.
More and more nicks, dings, dents, scrapes, and other minor damage not cost-efficient to repair.
Even when properly maintained via a vigorously enforced preventive maintenance schedule, the engine and other drivetrain components continue to operate and fuel efficiency can sometimes decline.
Driver morale will inevitably take a hit, as drivers are told to keep vehicles in service for many months, if not years, beyond the expected period.
In addition, drivers are less likely to agree to purchase out-of-service vehicles when mileage is much higher and interior and exterior conditions are deteriorated.
Finally, while vehicles are built significantly better today than 30 years ago when the current 36-month/65,000-75,000-mile policy became a widespread practice, the risk of major component failure increases, and fleet managers aren’t in the business to play with such risks.
Clearly, there are some very good reasons to extend fleet service life (and replacement policy) beyond existing levels to four or even five years and up to 90,000-95,000 miles, with acceptable risk and without an increase in cost. (Indeed, with a reasonable expectation lifecycle costs will actually decline.) Keep in mind:
Vehicles must be carefully and regularly maintained.
A regular schedule of condition reports with supervisor sign-off and consistent follow-up is required.
Going up to and beyond 100,000 miles may be acceptable; however, driver morale, as well as resale value, inevitably suffer.
Vehicles, both autos and light trucks, are built far better today than in the days when keeping them in service beyond 75,000 miles was taboo. Bumper-to-bumper warranties cover to 50,000 miles and beyond, and powertrain warranties extend to 100,000 miles, eliminating that major mechanical failure risk.
By managing that risk with preventive maintenance and repairing body damage quickly, fleet managers can extend service life on some vehicles to four or five years to save hundreds of thousands of dollars.
More Remarketing
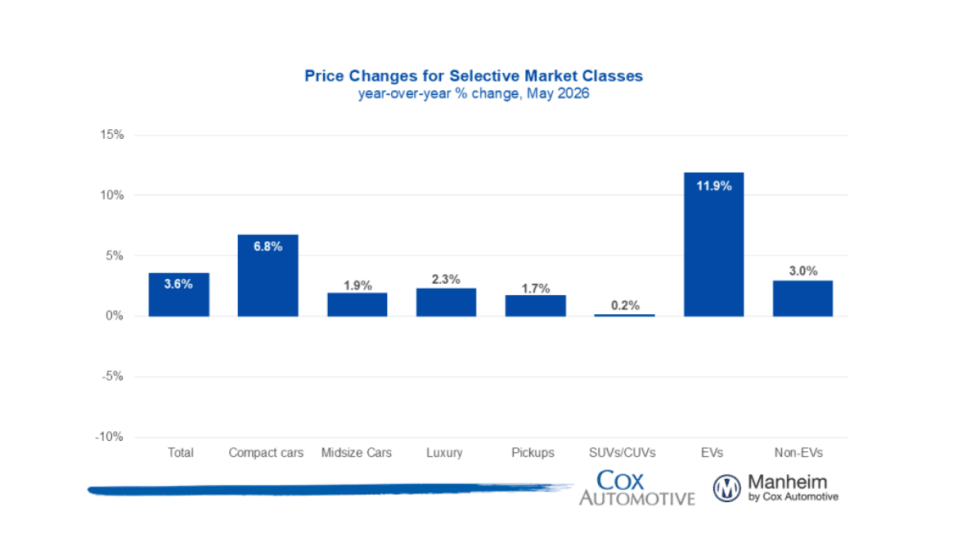
Wholesale Used Vehicle Market Sustains Moderate Rise In Values, Prices
Trends continue to normalize after a strong start to the year, as consumers contend with higher gas prices in the coming summer months.
Read More →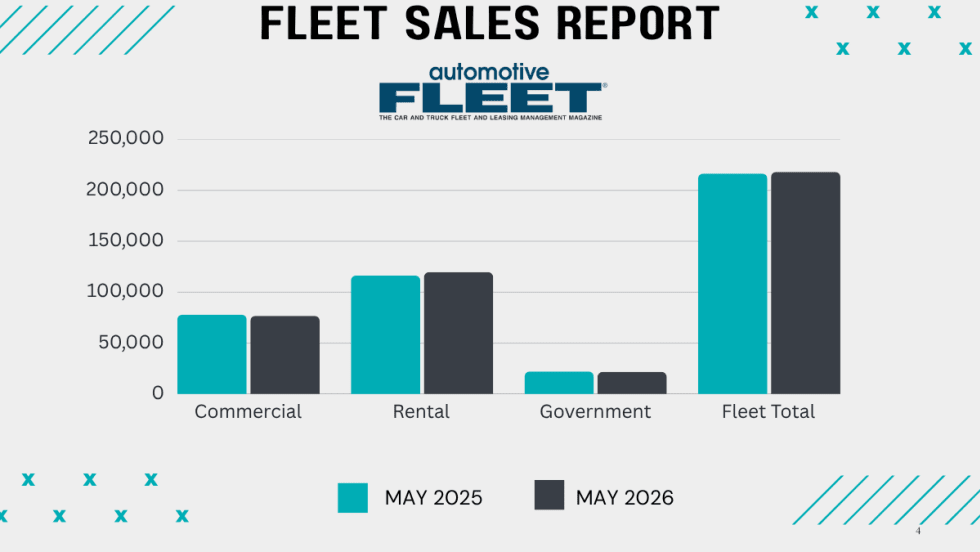
Commercial Fleet Sales Still Lead Sectors Despite May Mini Dip
The U.S. economy's continued growth and positive business investment are creating a favorable environment for fleet vehicle demand.
Read More →
How Connected Vehicle Data Is Lifting Fleet Resale Values
A vehicle health score could improve the value of fleet vehicles at remarketing. The path to a universal standard is forming, and fleets that understand the process early will be better positioned when it arrives.
Read More →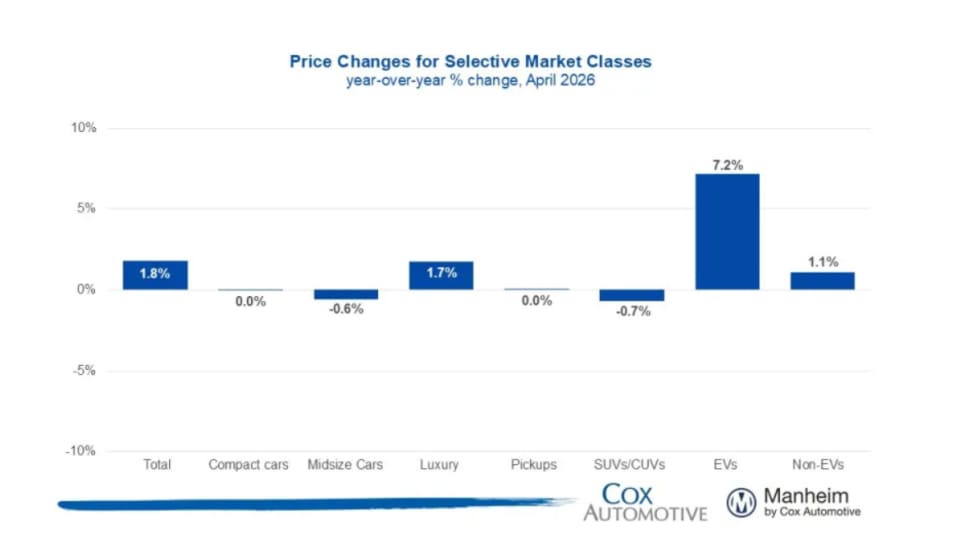
Wholesale Used Vehicle Prices Slightly Up In April
The Iranian conflict and rising gas prices inject much uncertainty into the future wholesale used vehicle markets, as higher gas prices soak up spendable income from vehicle buyers.
Read More →
CAR2026: James McKinley Wins Value Champion of the Year
James McKinley of City Rent a Truck was named the inaugural Fleet Value Champion at the CAR Conference for his data-driven approach to fleet lifecycle management and vehicle remarketing.
Read More →
CAR2026: Eric Autenrieth Wins Remarketer of the Year
Eric Autenrieth was recognized at this year's CAR Conference as the Remarketer of the Year.
Read More →
CAR2026: Lawrence Knapp Wins Consignor of the Year
Lawrence Knapp won the Cosigner of the Year award at this year's CAR Conference.
Read More →
2026 CAR Awards Celebrate Industry Excellence
CAR’s annual Fleet Remarketing Awards opened a reimagined 2026 conference designed to bridge the worlds of fleet management and automotive remarketing.
Read More →
Inside the CAR2026 Awards: Leaders, Legacy & What’s Next
Here's a look inside the awards ceremony at the CAR Conference, where industry leaders reflected on the growth, impact, and future of automotive remarketing.
Read More →
The Predictive Pivot: How AI and Data Are Redefining Auto Logistics in 2026
AI is no longer a luxury but the baseline for profitability in 2026. Auto haulers that adopt these tools now will quickly outpace those using manual workflows and taking a wait-and-see approach.
Read More →