

Cut Costs Using Fuel Management Reports
Many companies are turning to fuel card programs for their fueling needs. Data from these programs can be mined with significant savings.
Turmoil in the Middle East, hurricanes, massive demand from India and China, a strong consumption of fuel in the U.S. — these issues and more have led to increases in gasoline prices the likes of which we’ve never seen. With average prices hovering just under $3 per gallon, fleet managers have seen fuel expenses nearly double in the past 24 months.
Fuel card programs can be a strong weapon in the battle to control fuel expense, but unfortunately fleet managers don’t always use the immense flow of data such programs generate to its best advantage. Controlling fleet fuel costs goes well beyond simply tracking miles per gallon (mpg) fuel efficiency, or cents per mile (cpm) ratios. Most fuel management programs offer users excellent reporting tools that can be used to mine the data to determine where both use and dollars can be controlled.
As Always, Start with Fleet Policy
Your fleet policy document should speak to the limits the company places (if any) on the fuel for which it will pay. The policy should cover several key issues related to fuel usage:
Personal Use. Who is permitted to drive the vehicle, when, and how often?
Personal Use Chargebacks. How will the company charge drivers for personal use?
Vehicle Expense. Exactly what vehicle expense will the company pay, and what will be the responsibility of the driver?
Expense Reporting Process. Outline the full process by which vehicle expense is captured and the responsibilities of all stakeholders in that process.
Simply reviewing reams of data is not useful unless a process is in place to take action, and no action can be taken unless the “ground rules” are set up beforehand. That is the purpose of a policy document.
Manage with Exception Reports
There is little debate on how fleet managers can best review and act upon fleet expense data. Which drivers and vehicles fall within acceptable performance parameters is not important. It is of great importance who doesn’t. That is the purpose of exception reports.The first step in creating such reports is to establish benchmarks, which in turn create exceptions. Fleet managers track two primary data vis-à-vis fuel expense: fuel efficiency as expressed in miles per gallon (MPG), and overall fuel expense as expressed in cents per mile (CPM).
MPG benchmarks can have several sources:
EPA mileage estimates.
Internal MPG performance for similar make/model.
External MPG performance for like make/model, similar industries, or vehicle type.
Once benchmarks are established, fleet managers should determine the degree of difference that will prompt the exception report. Keep in mind that if this criterion is set too low (say, a 10-percent variance), too many exceptions are likely to appear. There are reasonable bases for a low level of variance that do not necessarily point to poor performance or program misuse. Generally, a 20-percent variance (if the benchmark is, say, 20 MPG, and the vehicle is achieving only 16 or greater than 24 MPG) will suffice.
Once exceptions are reported, it is usually relatively simple to weed out the most egregious. Major exceptions (a vehicle showing 5 or 50 MPG) are usually caused by reporting problems, such as wrong mileage. These exceptions can be corrected. MPGs dramatically lower than the benchmark can be caused by any number of reasons, some of which are actionable:
Preventive maintenance may not be up-to-date. Improperly maintained vehicles will not achieve the acceptable level of fuel efficiency.
Driving habits, such as quick starts and stops, can significantly affect mileage.
Urban territories, which entail more idling in traffic with attendant starts and stops, can hurt fuel efficiency. In addition, higher fuel costs combined with lower mileage will result in higher cpm figures.
It is important to note that with the volatility in fuel prices, CPM can be a deceiving statistic, especially if you are benchmarking internally (against prior years’ performance). A useful method of tracking overall fuel consumption that eliminates the effect of per-gallon price changes is “gallons per card ” — tracking gross gallons purchased by each issued card. Drivers who operate the same or similar vehicles, and drive similar mileages, should be purchasing roughly the same number of gallons each period examined. When using this method, adjust for (or at least consider) that different regions of the country can have wide swings in pricing.
Exception reports are a fast and effective method for tracking underperforming drivers and vehicles.
Monitor Purchasing Habits
A fuel management program will also provide data on the purchasing habits of your drivers, i.e., what they buy, when, and how. Here are some suggestions on which of these habits can increase your fuel expense.Type of Fuel. Fuel is usually available in three grades: regular, mid-range, and premium. Unless you operate luxury or sport vehicles, your fleet can no doubt be operated using regular unleaded fuel. The difference in price can be as much as 10 cents-per-gallon between grades, and the math shows that significant savings can result in eliminating higher-grade purchases. For example, a 1,000-vehicle fleet, driving an average of 24,000 miles-per-year per unit, will accumulate 24 million miles each year. At an average of 20 MPG, this translates to 1.2 million gallons of fuel. If the price difference is a mere 20 cents per gallon, and the fleet uses premium fuel at a 10-percent rate, eliminating such usage can save $24,000 per year.
Full- vs. Self-Service. Except for states such as New Jersey or Oregon where self-serving fuel is not permitted, your drivers may be using full-service fuel. With numbers similar to the preceding example, another $24,000 may be available for savings.
Unauthorized Fuel Purchases. Although difficult to quantify, you are no doubt paying for at least some fuel purchased in violation of company fleet policy, or that is outright fraudulent. Fueling non-fleet vehicles (spouses’ or other family members’ cars), or buying fuel for equipment, such as boats and lawnmowers, can add additional thousands to your fuel expense. Some companies have policies that do not reimburse drivers for fuel purchased for personal use. Again, thousands of dollars can be saved.
Non-Fuel Purchases. The dreaded “beer and Twinkie” factor can waste precious company dollars. A significant percentage of fuel is purchased at convenience store/gas station locations, where drivers are often tempted to buy non-fuel items (ranging from food to lottery tickets). Your fuel management vendor no doubt provides data showing such spending, which can be tracked via exception. Additionally, this practice can also be controlled by placing a “fuel only” control on fuel cards. Looking for “inside purchases” can also help pinpoint violations. The large majority of fuel merchants permit “pay at the pump,” card-swipe transactions. But drivers can circumvent this by simply choosing the “pay inside/credit” option, provided the clerk is willing to ring the entire transaction up as fuel.
More Fuel

Study: How 2026's Gas Price Hikes Affect Different Vehicle Types
New data from iSeeCars reveals how rising fuel costs have affected different vehicle segments as gasoline prices climbed nearly 46% over the past four months.
Read More →Are You Tracking Your Fleet's True Total Cost of Ownership?
Bobit Business Media surveyed 190 fleet professionals and found that while most fleets are tracking costs, fragmented systems and data gaps are keeping true TCO visibility out of reach. With rising pressure to control spend in an increasingly volatile environment, the gap between what fleets think they know and what the data actually shows is wider than you might expect. See how your peers are managing costs today and where the industry still has room to improve.
Read More →
May Fuel Update: All Regions Experience Declines
Gas prices are finally easing in much of the country, but experts warn global tensions could quickly reverse the trend as the national average remains well above last month’s levels.
Read More →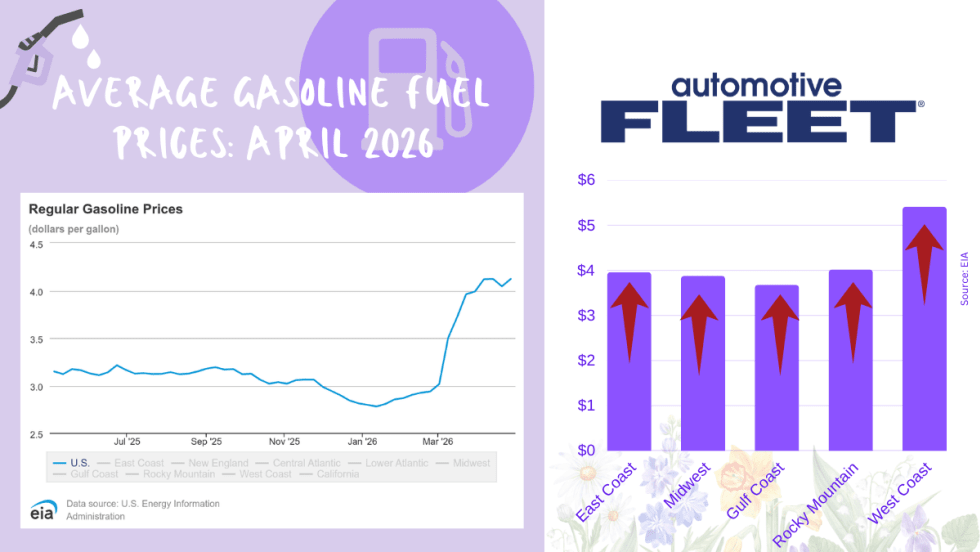
April Fuel Update: Prices Climb Above $4 as Spring Surge Accelerates
National average jumps to $4.04 per gallon, up sharply from last year, with West Coast prices topping $5 and further increases expected amid rising oil tensions.
Read More →
Tips from Fleet Managers on Saving Fuel Costs
Fleet leaders share practical strategies to reduce fuel spend through smarter policy, routing, and driver guidance.
Read More →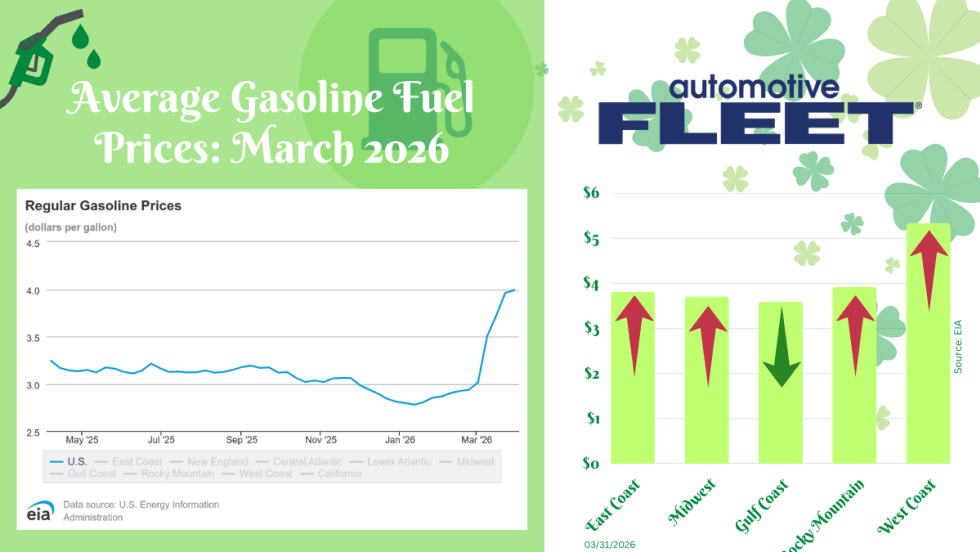
March Fuel Update: Prices Settle With a $4 Average
Fuel prices significantly slowed this week, but a $4 national average is still expected.
Read More →
Bob Adamsky on Fuel Volatility: “Don’t Panic — Have a Plan”
With oil prices rising again, AWP Safety’s fleet manager shares how to respond to rising fuel costs and how the right strategy can turn fuel spikes into cost-saving opportunities.
Read More →
Oil Market Turbulence Is Complicating Fleet Cost Planning
Rapid swings in crude oil prices driven by the conflict in the Middle East could create longer-term cost pressures for fleets, affecting fuel prices, supply chains, and vehicle strategy, says NTEA’s Andrew Wrobel.
Read More →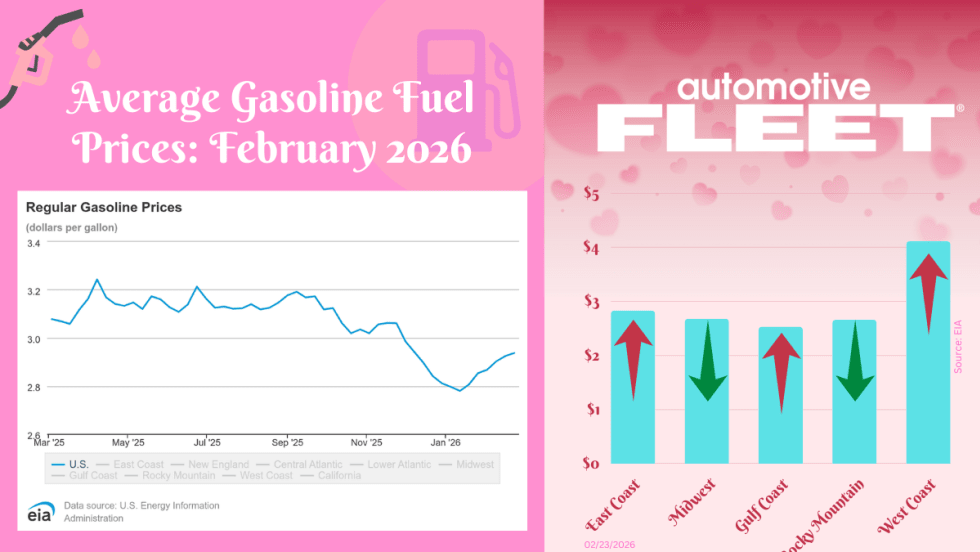
February Fuel Update: Prices Inch Higher for Third Week in a Row
The final February fuel update reveals prices continuing to inch higher for the third week in a row.
Read More →
The 2026 Fuel Economy Guide: Updated Cost and Efficiency Benchmarks for Fleets
Fleet managers can use the DOE’s 2026 Fuel Economy Guide to benchmark MPG across powertrain types using side-by-side vehicle ratings and compare new model-year options.
Read More →